-
Bradley Siderograph for Tradestation
The approach was introduced by Donald Bradley in 1948 in his book Stock Market Prediction — The Planetary Barometer and How to Use Itâ€.
The indicator draws the Bradley indication (Geocentric orignal formular) in your TradeStation chart (tested with TS2000i and TS8).
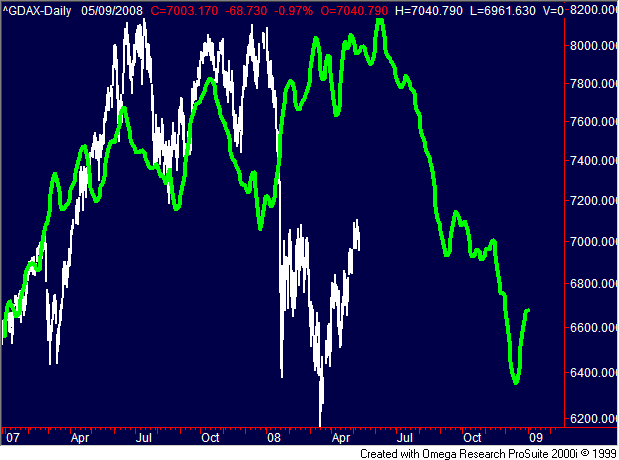
The screen shot shows the Bradley Siderograph for the years 2007 and 2008 as green line on top of the German DAX. Please remember the tool is not so much a price prediction but a timing instrument.
 How to install:
- Download the Bradley Indicator for TradeStation ZIP (1.3MB) here
- Extract the DLL in your windows/system32 director (or in the Tradestation bin directory wherever it is)
- Import the Bradley.ELS in your TradeStation
 How to use:
- Insert the indicator [SOULY] BradleyÂ
- The Bradley Siderograph is drawn in your chart window
- Make sure you add some space to the right of your chart (you probably want to see future turns)
- With the Expert Commentary tool you can click around and try to adjust the plot (still testing)
- The input onexone sets the strech-factor of the indicator (for the DAX in the example I took onexone=6
- Computable data range: 1994 to 2009 – so you have the chance for a lot of backtesting
Edit Feb 2010: The Planetary Indicator Package contains indicators to compute the Bradley without time limitations (for the last 100 years and the next 100 years if you want). So actually the ZIP here is obsolete.
Planet Ephemeris Data for TradeStation Bradley Siderograph for 2008 and 2009
One thought on “Bradley Siderograph for Tradestation”
Leave a Reply
Bradley Siderograph for Tradestation
Search
Recent Posts
- Update on S&P and 26 month cycle, 7 year cycle and Bradley
- Heliocentric Bradley vs Gold and Bonds
- Cycle Analysis S&P500
- Restart 2018
- Commitment of Traders: Sell signal in my new COT indicator
- Mid-November Low in S&P500
- Book recommendation: Timing Solutions for Swing Traders
- S&P: Time for a Turn?
- Indication of Planetary Returns in Tradestation
- Paintbar Study Showing when a Planet is in a Certain Sign
Tag Cloud
Really appreciate it. I was using a standard .csv, cutting and pasting this into a function….it took forever but it worked. Your’s is better. Many thanks!