-
Simple TradeStation Strategy based on Planetary Indicators
PlanetaryIndicators can be used to create trading systems working on planetary data.
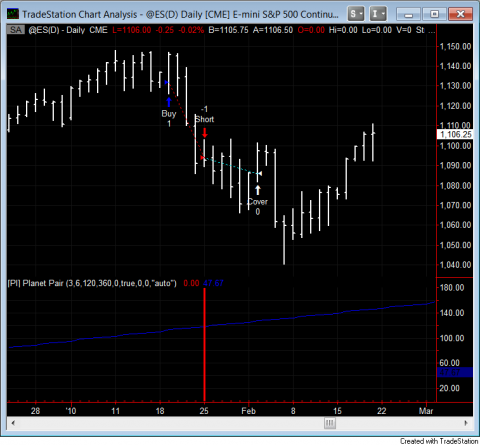
For the beginning I show a simple one. In two weeks (Jan 24th) Sun will be Trine to Saturn. Visual investigation (with [PI] Planet Pair) showed that the event often comes with a temporary top in stock markets. So how can we verify the observation? I create a Trading System that enters a long position one week before the event, turns it the day before the Trine and closes the Short a week later.
The screen shot shows the setup and the result (click on the figure to zoom in).
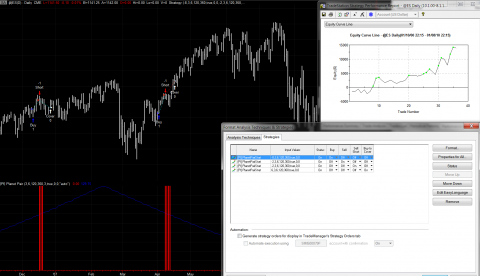
The applied strategy ([PI] PlanetPairStrat) is a general strategy for planet aspects. Just enter the aspect (in this case 3 for Sun and 6 for Saturn and 120 degrees) and the relative offset in days for the market action. For the buy rule the offset is -8 so we enter 7 days before the event (the enter rule is next bar at market).[PI] PlanetPairStrat is not yet part of the PI package, but it can be downloaded here:
pi_strategy1001.ZIP (4kB)
(The PI package has to be installed.)EDIT February:
This time the strategy was not so much a success: The BUY part had -37 Points and the SELL part had +8 Points. Maybe next time (Mid May)
Bradley Siderograph 2010 Next Bradley Date
Simple TradeStation Strategy based on Planetary Indicators

Search
Recent Posts
- Update on S&P and 26 month cycle, 7 year cycle and Bradley
- Heliocentric Bradley vs Gold and Bonds
- Cycle Analysis S&P500
- Restart 2018
- Commitment of Traders: Sell signal in my new COT indicator
- Mid-November Low in S&P500
- Book recommendation: Timing Solutions for Swing Traders
- S&P: Time for a Turn?
- Indication of Planetary Returns in Tradestation
- Paintbar Study Showing when a Planet is in a Certain Sign
Tag Cloud