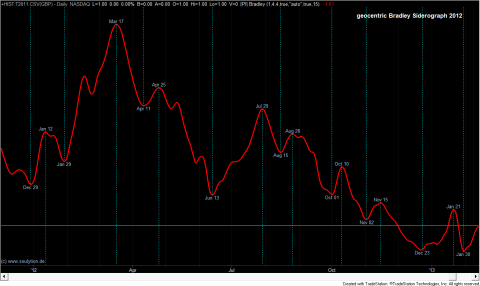
Bradley Siderograph 2012

Here is plot for the year 2012 of the geocentric default Bradley siderograph as described in Donald Bradley’s “Stock Market Prediction – The Planetary Barometer and How to Use It “. The plot was made with the [PI] Bradley indicator which it is part of the PlanetaryIndicators package for Tradestation. In case you do not […]

Commitment of Traders: Implications of Large Traders going short

Beside the various timing indicators presented on this page, I particularly have an eye on instruments describing the sentiment in the markets. One free and good source for sentiment data is the weekly Commitments of Traders report issued by the Commodity Futures Trading Commission. For several future markets it enumerates the positions of market participants […]

It’s Bradley Time

This weekend the geocentric Bradley indicator has the high for the year. At the same time (not coincidentally) my preferred planetary aspects indicator shows the highest activity since forever. The following chart shows both indicators and the S&P500 which is making new highs. Basically, it can be assumed that such a cluster of aspects will […]

On the Compatibility of the Planetary Indicators to MultiCharts

The Plantary Indicators have been developed in Easy Language (EL) for Tradestation (TS) platforms. Multicharts (MC) is somewhat compatible to the EL intepretation of TS. And to the best of my knowledge they comile and run without errors on MC starting from version 6. However, one function that does not work for most indicators is […]

Update 10/2011

After some time here are some charts, showing I’m still here and that the indicators work quite well in Tradestation 9. The charts show the current situation of the S&P500 ($INX). In the Delta chart we do not even need an adaptation of the Medium Time cycle (yellow areas in the chart). However, it seems […]

in Misc

Bradley 2011

S&P and the five passages of the Saturn/Uranus Opposition 2008-10

Last week was the last of the five passages of the Saturn-Uranus opposition that started two years ago. The chart below highlights the five dates in the chart of the S&P500. While the last one is still unfolding we can already say that each of the five events was at least a swing top. And […]

This weekend’s Jupiter Ingress

The Jupiter ingress coming this weekend is the third since January 2009 . The last two coincided exactly (!) with important medium term highs (see yellow lines in chart below). So it appears to be justified to assume a high within the next few days!? The chart definitely suggests so, but extending the history reveals […]

Delta and the Inversion on 8

Delta experts know that the cycle can only invert at the beginning or at end. The 12 point cycle I’ve been using for the S&P should only turn around the 1 (as it did this February). After that inversion all delta points in the cycles came quite in time. But with the 9 (actually already […]

about the start of the correction

The start of the current down move did not came out of the blue. In fact it came exactly with two significant astro signatures: The first first chart shows the 5 passes of the geocentric Oppostion of Saturn and Uranus between November 2008 and July 2010. In average each pass was followed by a 3 […]

Previous Posts Next posts