Mid-November Low in S&P500
The following charts show how the planetary idicators could help to time the exit of the short position we entered at the quadruple ingress early October.
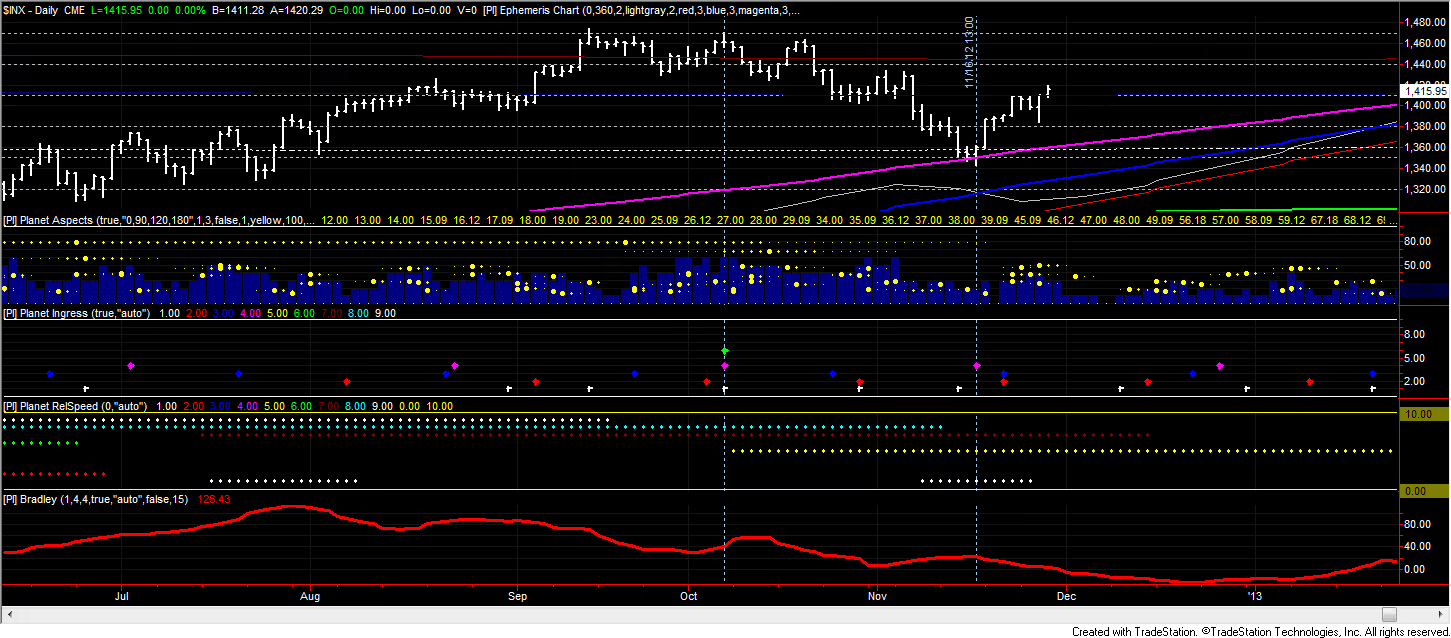
The S&P500 (chart of the index) went down to the Mars ephemeris line and bounced back the very day Mars had its ingress to Capricorn. Additionally we had a small peak in the Bradley indicator. Reason enough to take this low seriously – even though this time we had no peak in PI Aspects.
This also happened on an important absolute Square-of-Nine prive level as shown in the following chart.
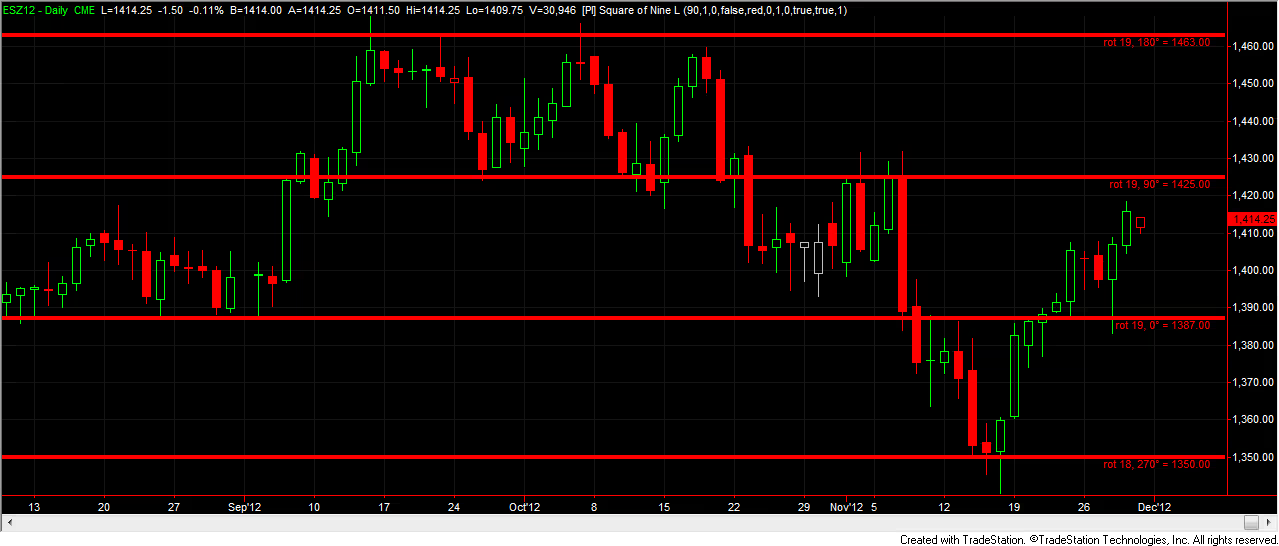
I will discuss the Square of Nine indicators for price and time in more detail soon as they are a valuable addition to the planetary indicators.