PLANETARY INDICATORS

Planetary Indicators

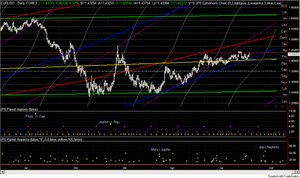
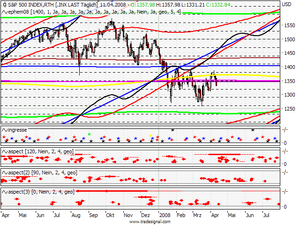
PlanetaryIndicators is a indicator package for TradeStation developed in cooperation with www.planetaryindicators.com. The package contains several indicators showing planetary lines, planetary aspects, ingresses, natal comparison charts, eclipses. It allows to filter planetary postions and is an easy way to test approaches written by experts, but also to develop own ideas.

Download PlanetaryIndicators for TradeStation

The embedded license manager allows a 30 days trial for free. (can be extended on request) A first version of the package for TS2000i can be downloaded here:

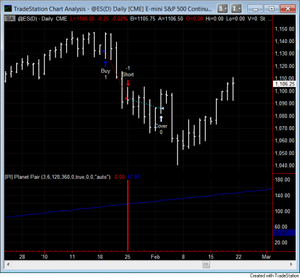
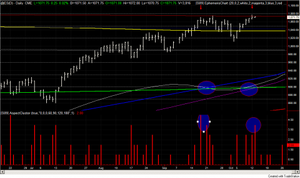
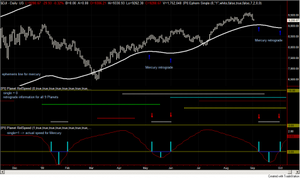
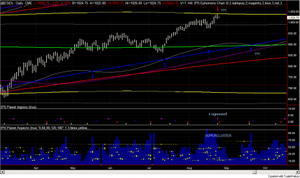
The main package has to be installed. The TS2000k version does not yet contain all indicators. The programming interface for own developments is included. Below you can find some example applications of the indicators.


Heliocentric Bradley vs Gold and Bonds

The Bradley Siderograph ([PI] Bralkey) can be applied to a variety of markets – sometimes with amazing results. In this article you can see the geocentric Bradley with default settings, projected on a Gold (@GC) and Bonds (@TY) charts. The Bradley is red and the market price is white. The overlap for the last 4 years – in particular for Gold – is mind blowing: important turning points and the market direction were predicted with an astonishing precision (note that the red plot was defined 70 yea […]

Mid-November Low in S&P500

The following charts show how the planetary idicators could help to time the exit of the short position we entered at the quadruple ingress early October. […]

S&P: Time for a Turn?

A simple approach to use astro indicators is to wait for situations when several indicators deliver important signals at the same time – and then speculate for something important to happen. […]

Indication of Planetary Returns in Tradestation

The theory of Planetary Returns follows the notion that important situations in the life of a company, a country or a person repeat with a period that is determined by the time a planet needs to travel around the Sun or (virtually) the Earth. That means, when a planet is back at the same position it had when a pivotal event took place, we can expect a similarly important event again. […]

Paintbar Study Showing when a Planet is in a Certain Sign

I got the request to code a paintbar study that would paint the bars while a planet was in a certain sign. Say like when Mars is in Taurus? And here it is: It highlights the bar for which a planet (you can set) is in a certain sign. The example chart highlights Mars in Taurus. […]

Bradley Siderograph 2012

Here is plot for the year 2012 of the geocentric default Bradley siderograph as described in Donald Bradley’s “Stock Market Prediction – The Planetary Barometer and How to Use It “. […]

On the Compatibility of the Planetary Indicators to MultiCharts

The Plantary Indicators have been developed in Easy Language (EL) for Tradestation (TS) platforms. Multicharts (MC) is somewhat compatible to the EL intepretation of TS. And to the best of my knowledge they comile and run without errors on MC starting from version 6. […]

Update 10/2011

After some time here are some charts, showing I’m still here and that the indicators work quite well in Tradestation 9. The charts show the current situation of the S&P500 ($INX). […]

This weekend’s Jupiter Ingress

The Jupiter ingress coming this weekend is the third since January 2009 . The last two coincided exactly (!) with important medium term highs (see yellow lines in chart below). So it appears to be justified to assume a high within the next few days!? […]

Next Bradley Date

There has been some confusion about the exact date of the next (this year’s high) Bradley turn date. […]

Simple TradeStation Strategy based on Planetary Indicators

PlanetaryIndicators can be used to create trading systems working on planetary data. […]

S&P500 update Oct/11th 2009

Once again an example� with just� the @ES,� the ephemeris lines,� and� this� time with� the aspect� cluster� indicator. […]

Indication of Planetary Retrograde Movement

The PlanetaryIndicators package allows to show periods of planetary retrograde movement either direct (using direct ephemeris) or as dedicated indicator. Retrograde means that a planet moves backward as seen from Earth. There are several theories that a planet turning retrograde (or back direct) has direct implication for markets. […]

EURUSD and heliocentric Bradley

Our old friend the Bradley Siderograph is also part� of the Planetaryindicator package. […]

Example: S&P500 Future (@ES) with geocentric Elements

At the end of the geocentric supercluster (10 important aspects) now we have 4 ingresses (Mars, Earth, Venus, Mercury) within few days. Right now the @ES (as well as the INX) is at Jupiter line (yellow in the chart). Whatever happens now will have some significance. My guess is shown by the arrows. […]

EURUSD heliocentric basic analysis

The chart shows the heliocentric planetary ephemeris lines, the heliocentric ingresses in a separate window, and the heliocentric conjunctions in another window. […]

Bradley Siderograph for 2008 and 2009

Took a while but here are the first pictures of the Bradley Siderograph (default version) drawn in TradeSignal. I like the improved quality of the plots. […]

Planeten Ingresse für tradesignal

obsolete indicators for the obsolete platform tradesignal […]

Easy Language Programming Interface for Planetary Data

The ephemeris data as it is basis for the planetary indicators can be accessed directly within any Easy Language code. The interface is the function named $pi_ephem. It is part of the planetaryindicators package and can be used for Indicators, Signals, or Strategies. […]

See all tags.