Bradley Siderograph 2010
Happy New Year 2010!
Looking at the Bradley graph this year can be quite interesting:
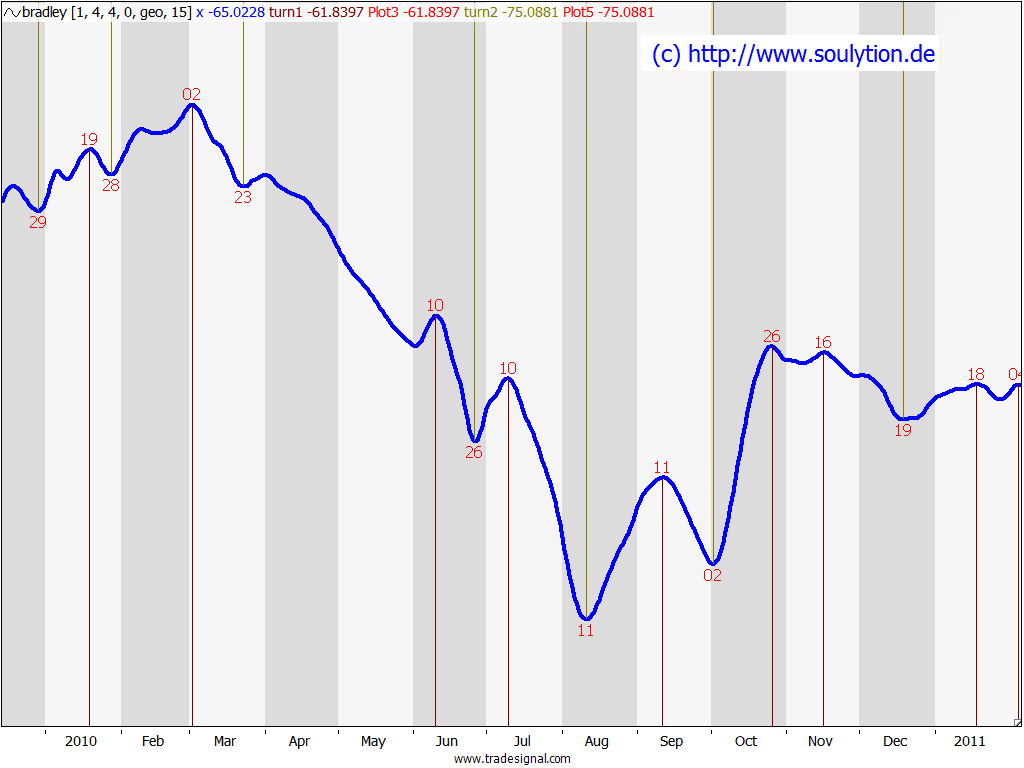
Sure, the one year view is not so impressive. But have a look at the long term. The low of geocentric Bradley in 2010 is the lowest low since 1900.
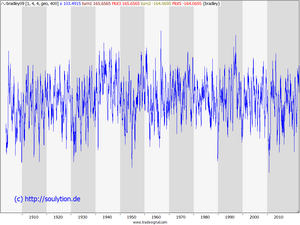
Such extreme points in the Bradley do not necessarily mean there will be a sort of crash. They don’t even mean that there will be any sort of low. Rather they usually indicate the end of one (long term) cycle in the markets and the start of a new one.
Now is the question: will it conclude the consolidation in stock markets we’ve seen in the last ten years? Or will it finally finish the bull market that started 30/40 years ago? Guess what, I don’t know 🙂