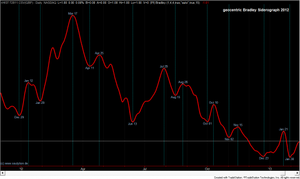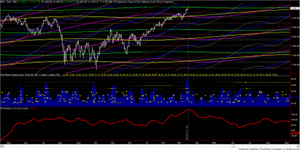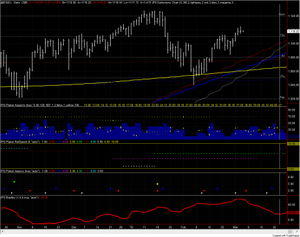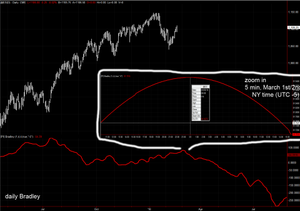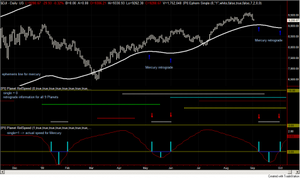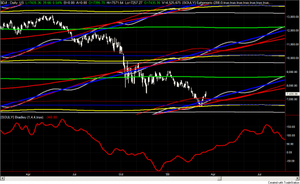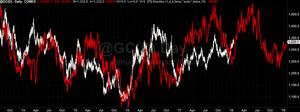
Heliocentric Bradley vs Gold and Bonds
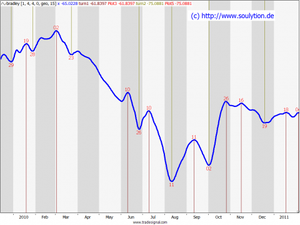
The Bradley Siderograph ([PI] Bralkey) can be applied to a variety of markets – sometimes with amazing results. In this article you can see the geocentric Bradley with default settings, projected on a Gold (@GC) and Bonds (@TY) charts. The Bradley is red and the market price is white. The overlap for the last 4 years – in particular for Gold – is mind blowing: important turning points and the market direction were predicted with an astonishing precision (note that the red plot was defined 70 yea […]