S&P500 in March 2010: Bradley vs. Planetary Aspects
Stock Markets show new 5 weeks highs and the Bradley Siderograph indicates a turn – so do we have to sell now?
The Bradley is just a composition of several planetary aspects. Hence it can be assumed that studying the isolated planetary aspects that occur these days could tell us a bit more about what we can expect in near future:
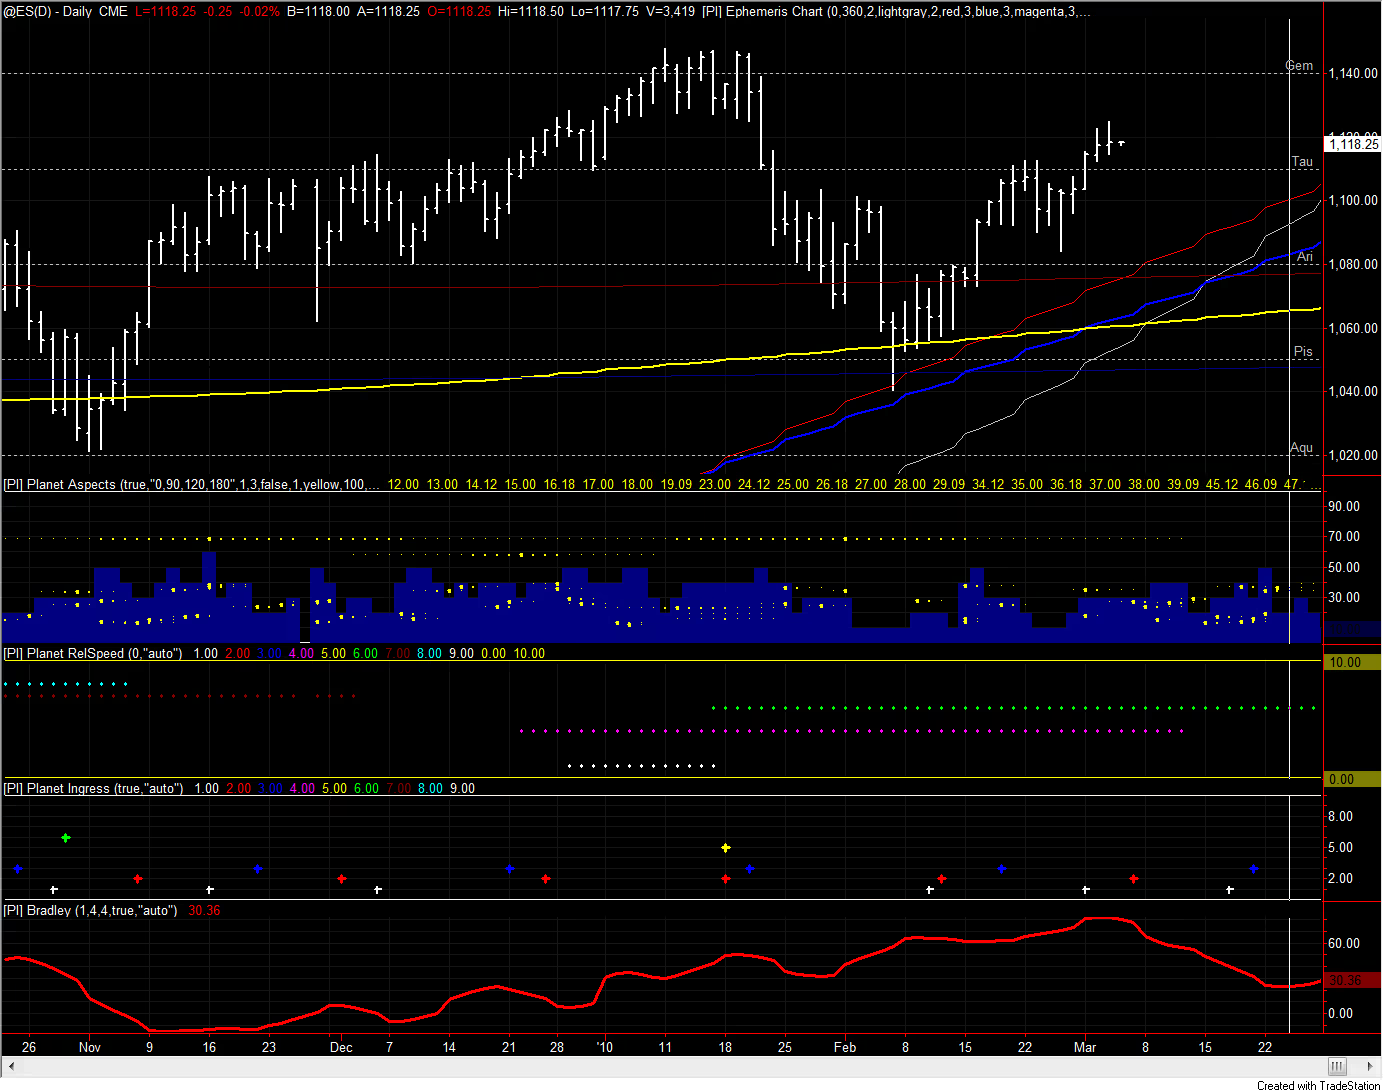
Applying [PI] Planet Aspects to a daily chart shows the important aspects for this week:
(1) Thursday: Venus conjunct Uranus
(2) Sunday: Venus trine Mars
(3) Next Monday: Mercury conjunct Jupiter
(4) Next Tuesday: Venus opposite Saturn
I tested the four aspects using the [PI] PlanetPair Strat Strategy with simple preferences: Enter a long position in S&P500 the day the aspect occurs and exit 5 days later. The test data is the S&P since 1995.
|
Aspect |
Trades Profitable |
Total Points |
|
(1) Venus conj. Uranus |
12/15 (80%) |
137 |
|
(2) Venus trine Mars |
14/18 (78%) |
152 |
|
(3) Mercury conj. Jupiter |
14/19 (74%) |
208 |
|
(4) Venus opp. Saturn |
10/14 (71%) |
166 |
Have you ever seen such a cluster of positive aspects in such a short time span? It’s hard to believe a top is in before these aspects could unfold their power. To get a more realistic result I filtered the entries that occurred during an intermediate up trend (as we have it right now)
| Aspect | Trades Profitable | Total Points |
| (1) Venus conj. Uranus | 5/7 (71%) | 24 |
| (2) Venus trine Mars | 9/12 (75%) | 135 |
|
(3) Mercury conj. Jupiter |
7/8 (87%) |
98 |
|
(4) Venus opp. Saturn |
2/4 (50%) |
11 |
In that case the results are not as great, but still quite positive. So none of the four aspects can be considered as typical “crest-signatureâ€. Rather a continuation of the uptrend is likely.
Chances are better (though not perfect) we’ll see a  crest mid of March when retrograde Mars turns direct and there is another cluster of planetary aspects. However, for now it’s very likely that the planetary aspects are going to rule over the apparent implications of March Bradley turn date. …at least in S&P500.