about the start of the correction
The start of the current down move did not came out of the blue. In fact it came exactly with two significant astro signatures:
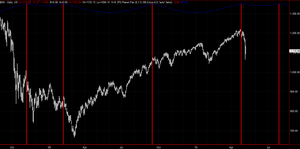
The first first chart shows the 5 passes of the geocentric Oppostion of Saturn and Uranus between November 2008 and July 2010. In average each pass was followed by a 3 week down move of about 20%.The high came exactly with the fourth pass.
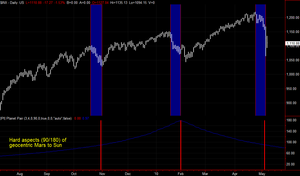
The second chart shows the hard aspects (90 and 180 degree) of geocentric Mars and Sun. In each case the market topped 10 days before the exact aspect, and bottomed shortly after the aspect. The high came 10 days before the squaring, the low (up to now) one day after the aspect.
Implications…? It’s likely to be a correction rather than a final top. I simply could not find indications for a long term high. It does not look so great though.
In both charts I’ve used the [PI]Â Planet Pair indicator. The settings can be seen in the charts.