S&P and the five passages of the Saturn/Uranus Opposition 2008-10
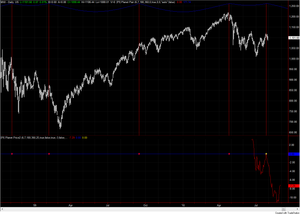
Last week was the last of the five passages of the Saturn-Uranus opposition that started two years ago. The chart below highlights the five dates in the chart of the S&P500. While the last one is still unfolding we can already say that each of the five events was at least a swing top. And the results are impressive:
Each top came after a Rallye of two weeks and 5 percent (or more)Â and was followed by a slide of two to four weeks with losses of ten percent in average.
The bottom indicator shows the relative price movement calibarated to the date of last weeks’ passage.