Update on S&P and 26 month cycle, 7 year cycle and Bradley
This is a follow-up to the cycle analysis posted a month ago. There we saw that the 26 month and 7 year cycle have been the dominant cycles of the S&P 500. […]
souly’s coding-for-trading solutions
This is a follow-up to the cycle analysis posted a month ago. There we saw that the 26 month and 7 year cycle have been the dominant cycles of the S&P 500. […]
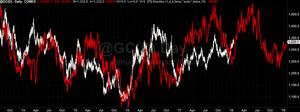
The Bradley Siderograph ([PI] Bralkey) can be applied to a variety of markets – sometimes with amazing results. In this article you can see the geocentric Bradley with default settings, projected on a Gold (@GC) and Bonds (@TY) charts. The Bradley is red and the market price is white. The overlap for the last 4 years – in particular for Gold – is mind blowing: important turning points and the market direction were predicted with an astonishing precision (note that the red plot was defined 70 yea […]
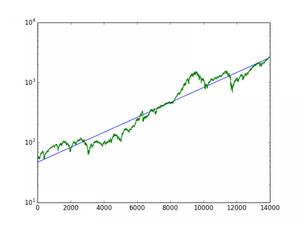
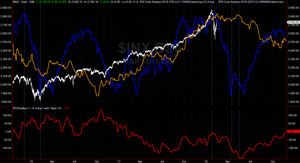
In this article, I study long term cycles and cyclic behavior of the US stock market. The aim of the study is identification of dominant and practically useful cycles. In particular, I’m interested in cyclic behavior that is projected to appear in the next 6-12 months. […]
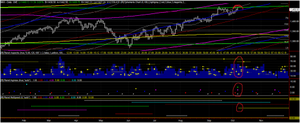
Last year I already wrote about the Commitment of Traders (COT) reports and how they can be applied to improve trading results. I showed that for the S&P500 the Large traders are the ones to watch – because in this market they have the tendency to jump on the train right at the very end of a trend. […]
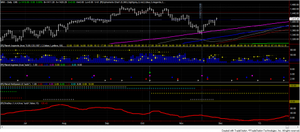
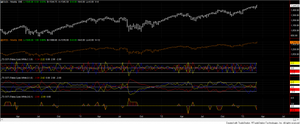
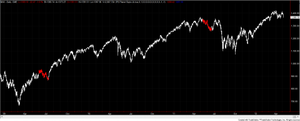
The following charts show how the planetary idicators could help to time the exit of the short position we entered at the quadruple ingress early October. […]
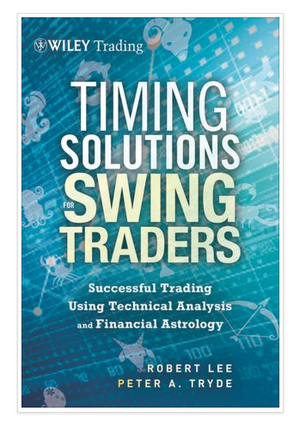
In this book Robert Lee and Peter Tryde show how financial astrology can be embedded in solid trading approaches without drifting into pseudo-scientific esoteric. It does not come up with some magic that tells you the price of a market in six months – no it helps to make good decision in the markets with standard indicators, supported by timing information derived from the planets. If you follow my work then you know that this is what the planetary indicators are made for. So I am very glad to […]
A simple approach to use astro indicators is to wait for situations when several indicators deliver important signals at the same time – and then speculate for something important to happen. […]
The theory of Planetary Returns follows the notion that important situations in the life of a company, a country or a person repeat with a period that is determined by the time a planet needs to travel around the Sun or (virtually) the Earth. That means, when a planet is back at the same position it had when a pivotal event took place, we can expect a similarly important event again. […]
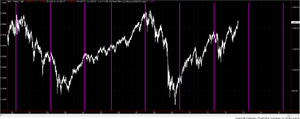
I got the request to code a paintbar study that would paint the bars while a planet was in a certain sign. Say like when Mars is in Taurus? And here it is: It highlights the bar for which a planet (you can set) is in a certain sign. The example chart highlights Mars in Taurus. […]
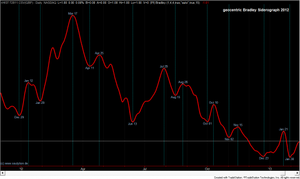
Here is plot for the year 2012 of the geocentric default Bradley siderograph as described in Donald Bradley’s “Stock Market Prediction – The Planetary Barometer and How to Use It “. […]
34 more posts can be found in the archive.