Update on S&P and 26 month cycle, 7 year cycle and Bradley
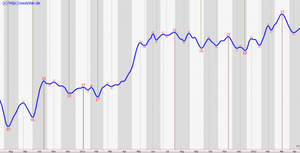
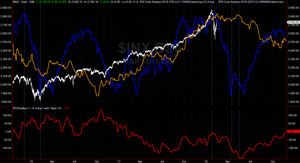
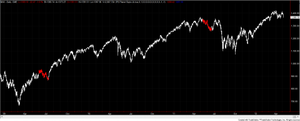
This is a follow-up to the cycle analysis posted a month ago. There we saw that the 26 month and 7 year cycle have been the dominant cycles of the S&P 500. […]
souly’s coding-for-trading solutions
misc (4), planetaryindicators (19), tradestation (16), astro (17), bradley (3), research (3), cycles (1),
This is a follow-up to the cycle analysis posted a month ago. There we saw that the 26 month and 7 year cycle have been the dominant cycles of the S&P 500. […]
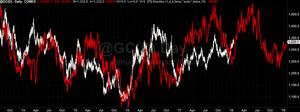
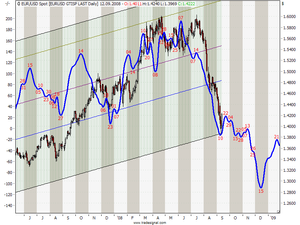
The Bradley Siderograph ([PI] Bralkey) can be applied to a variety of markets – sometimes with amazing results. In this article you can see the geocentric Bradley with default settings, projected on a Gold (@GC) and Bonds (@TY) charts. The Bradley is red and the market price is white. The overlap for the last 4 years – in particular for Gold – is mind blowing: important turning points and the market direction were predicted with an astonishing precision (note that the red plot was defined 70 yea […]
In this article, I study long term cycles and cyclic behavior of the US stock market. The aim of the study is identification of dominant and practically useful cycles. In particular, I’m interested in cyclic behavior that is projected to appear in the next 6-12 months. […]
Last year I already wrote about the Commitment of Traders (COT) reports and how they can be applied to improve trading results. I showed that for the S&P500 the Large traders are the ones to watch – because in this market they have the tendency to jump on the train right at the very end of a trend. […]
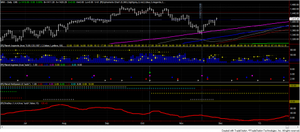
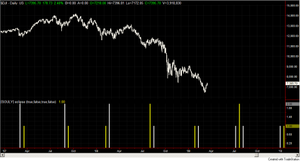
The following charts show how the planetary idicators could help to time the exit of the short position we entered at the quadruple ingress early October. […]
In this book Robert Lee and Peter Tryde show how financial astrology can be embedded in solid trading approaches without drifting into pseudo-scientific esoteric. It does not come up with some magic that tells you the price of a market in six months – no it helps to make good decision in the markets with standard indicators, supported by timing information derived from the planets. If you follow my work then you know that this is what the planetary indicators are made for. So I am very glad to […]
A simple approach to use astro indicators is to wait for situations when several indicators deliver important signals at the same time – and then speculate for something important to happen. […]
The theory of Planetary Returns follows the notion that important situations in the life of a company, a country or a person repeat with a period that is determined by the time a planet needs to travel around the Sun or (virtually) the Earth. That means, when a planet is back at the same position it had when a pivotal event took place, we can expect a similarly important event again. […]
I got the request to code a paintbar study that would paint the bars while a planet was in a certain sign. Say like when Mars is in Taurus? And here it is: It highlights the bar for which a planet (you can set) is in a certain sign. The example chart highlights Mars in Taurus. […]
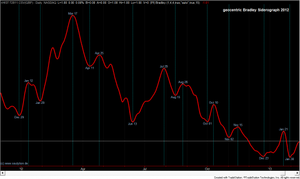
Here is plot for the year 2012 of the geocentric default Bradley siderograph as described in Donald Bradley’s “Stock Market Prediction – The Planetary Barometer and How to Use It “. […]
Beside the various timing indicators presented on this page, I particularly have an eye on instruments describing the sentiment in the markets. One free and good source for sentiment data is the weekly Commitments of Traders report issued by the Commodity Futures Trading Commission. For several future markets it enumerates the positions of market participants grouped in Small, Large, and Commercial traders. Frequently, two general approaches are proposed how to use the data: 1. look at the posit […]
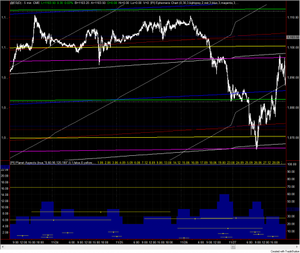
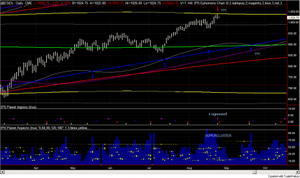
This weekend the geocentric Bradley indicator has the high for the year. At the same time (not coincidentally) my preferred planetary aspects indicator shows the highest activity since forever. The following chart shows both indicators and the S&P500 which is making new highs. […]
The Plantary Indicators have been developed in Easy Language (EL) for Tradestation (TS) platforms. Multicharts (MC) is somewhat compatible to the EL intepretation of TS. And to the best of my knowledge they comile and run without errors on MC starting from version 6. […]
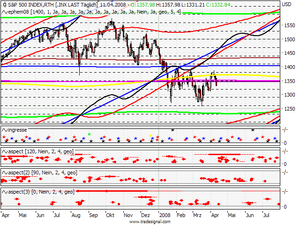
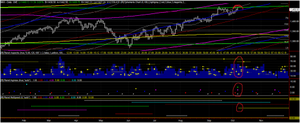
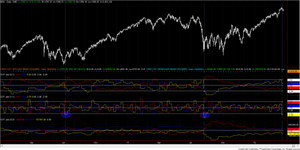
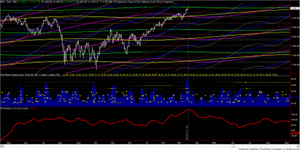
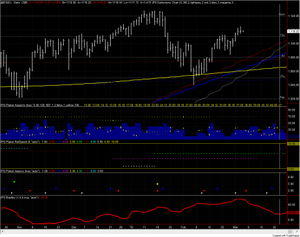
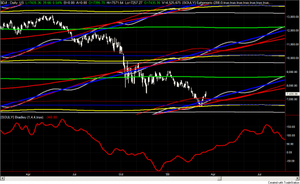
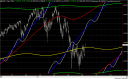
After some time here are some charts, showing I’m still here and that the indicators work quite well in Tradestation 9. The charts show the current situation of the S&P500 ($INX). […]
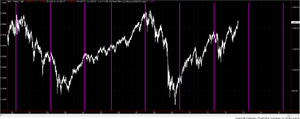
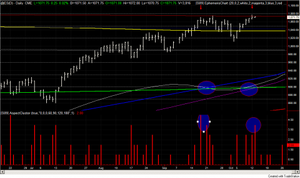
Last week was the last of the five passages of the Saturn-Uranus opposition that started two years ago. The chart below highlights the five dates in the chart of the S&P500. While the last one is still unfolding we can already say that each of the five events was at least a swing top. And the results are impressive: […]
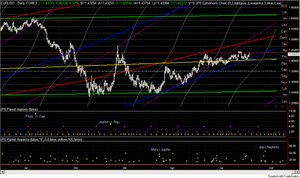
The Jupiter ingress coming this weekend is the third since January 2009 . The last two coincided exactly (!) with important medium term highs (see yellow lines in chart below). So it appears to be justified to assume a high within the next few days!? […]
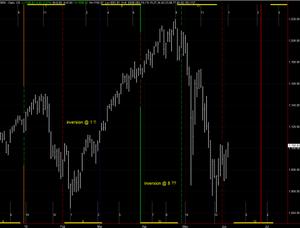
Delta experts know that the cycle can only invert at the beginning or at end. The 12 point cycle I’ve been using for the S&P should only turn around the 1 (as it did this February). […]
The start of the current down move did not came out of the blue. In fact it came exactly with two significant astro signatures: […]
Stock Markets show new 5 weeks highs and the Bradley Siderograph indicates a turn – so do we have to sell now? […]
There has been some confusion about the exact date of the next (this year’s high) Bradley turn date. […]
PlanetaryIndicators can be used to create trading systems working on planetary data. […]
Finally I finished the new version of the planetary indicator package. Ok, it’s not really finished because there are still thousand things to add, to refine, to do… […]
Once again an example� with just� the @ES,� the ephemeris lines,� and� this� time with� the aspect� cluster� indicator. […]
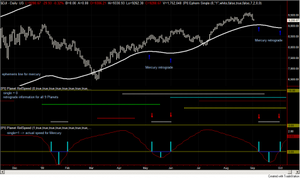
The PlanetaryIndicators package allows to show periods of planetary retrograde movement either direct (using direct ephemeris) or as dedicated indicator. Retrograde means that a planet moves backward as seen from Earth. There are several theories that a planet turning retrograde (or back direct) has direct implication for markets. […]
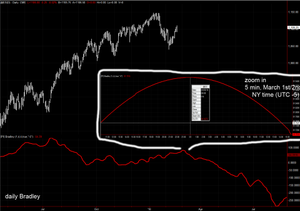
Our old friend the Bradley Siderograph is also part� of the Planetaryindicator package. […]
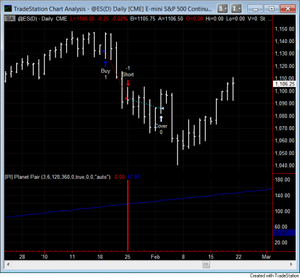
At the end of the geocentric supercluster (10 important aspects) now we have 4 ingresses (Mars, Earth, Venus, Mercury) within few days. Right now the @ES (as well as the INX) is at Jupiter line (yellow in the chart). Whatever happens now will have some significance. My guess is shown by the arrows. […]
The chart shows the heliocentric planetary ephemeris lines, the heliocentric ingresses in a separate window, and the heliocentric conjunctions in another window. […]
In “The Delta Phenomenon†Welles Wilder described something he believes is the “hidden order in all marketsâ€. Now 26 years later the idea has been published in a lot of books and papers, and is no secret anymoreBasically the idea is that market vibration repeats […]
With this post I present a new version of the astro library for TradeStation. The new version allows to compute so many cool things around the planets, with much higher precision than previous version. […]
I became curious if Lunar and Sun Eclipses can be used as timing tool in the markets. The results are not as clear as I hoped - but let’s study it a bit closer. […]
One problem I’ve always had is that TS can perfectly show data and indications for everything what happened in history, but there is no convenient way to show predictions in the future. This is particulary annoying if it’s about astro-indications. […]
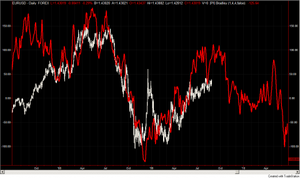
Last weeks turn was one day after Bradley Turn. Previous Bradley turn was exactly the High (June 14). Looks like the EURUSD is the better SPX […]
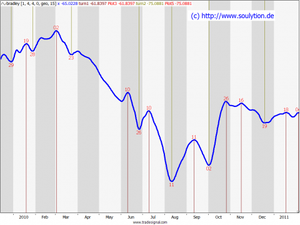
Took a while but here are the first pictures of the Bradley Siderograph (default version) drawn in TradeSignal. I like the improved quality of the plots. […]
The approach was introduced by Donald Bradley in 1948� in his book Stock Market Prediction — The Planetary Barometer and How to Use It”. […]
Last year I posted the Adam Projection for Tradestation (see original posting). […]
I just finished a first version of the Planet Ephemeris Indicator for TradeStation. It is an early test version working with TS2000i and TS8 […]
The ephemeris data as it is basis for the planetary indicators can be accessed directly within any Easy Language code. The interface is the function named $pi_ephem. It is part of the planetaryindicators package and can be used for Indicators, Signals, or Strategies. […]
I added a new section named “PlanetaryIndicators”. There I’ll describe the new PI-package for TradeStation and show several examples. I think it is a great composition of astro indicators , but I guess I have to introduce the instruments over time. […]
This page has been inactive for a while. I am sorry. I was pretty busy with my research position and just had little time for trading, research about trading, programming, or even writing about trading. But I am back – and soon new content will follow. My article about trading cycles should appear in the next few days. I also plan to go through my previous articles and see how my ideas and suggestions of the past worked out in the last few years. […]
This is the first post. […]