-
Indication of Planetary Returns in Tradestation
The theory of Planetary Returns follows the notion that important situations in the life of a company, a country or a person repeat with a period that is determined by the time a planet needs to travel around the Sun or (virtually) the Earth. That means, when a planet is back at the same position it had when a pivotal event took place, we can expect a similarly important event again.
In the simplest case, it relates to the Earth traveling around the Sun for what it needs exactly one year. In this case the Planetary return corresponds to a birthday of a company or person – but also signals for seasonal rules like ‘Sell in May’.
Planetary Returns are not only valid for the Earth/Sun cycle but also (and in particular) for the outer planets. But indeed, such non-yearly planetary cycles are not as easy to observe…
Actually, it is with the [PI] Planet Filter indicator as it is part of the standard package of PlanetaryIndiactors for Tradestation. [PI] Planet Filter highlights dates of full planetary return to a given date or just fractions (180 degrees or 90 degrees or less) of a complete cycle.
In the following I discuss two ways how to use this function:
Forward projection from a given point in history:
Here it is the basic notion that whenever a planet comes back to the position it had on a specific pivotal event, chances increase an event with similar importance may happen.
Starting points can be:
- important highs or lows in the market
- date of first listing of the stock
- date of formation of the organization
To see the planetary returns for such dates in Tradestation, just add the indicator [PI] Planet filter, select the planet, and n the parameter relativeToDate set the date of the pivotal starting point.
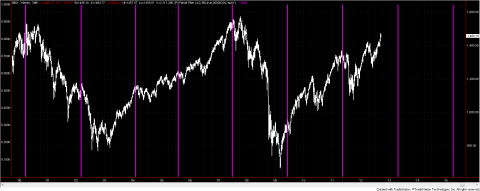
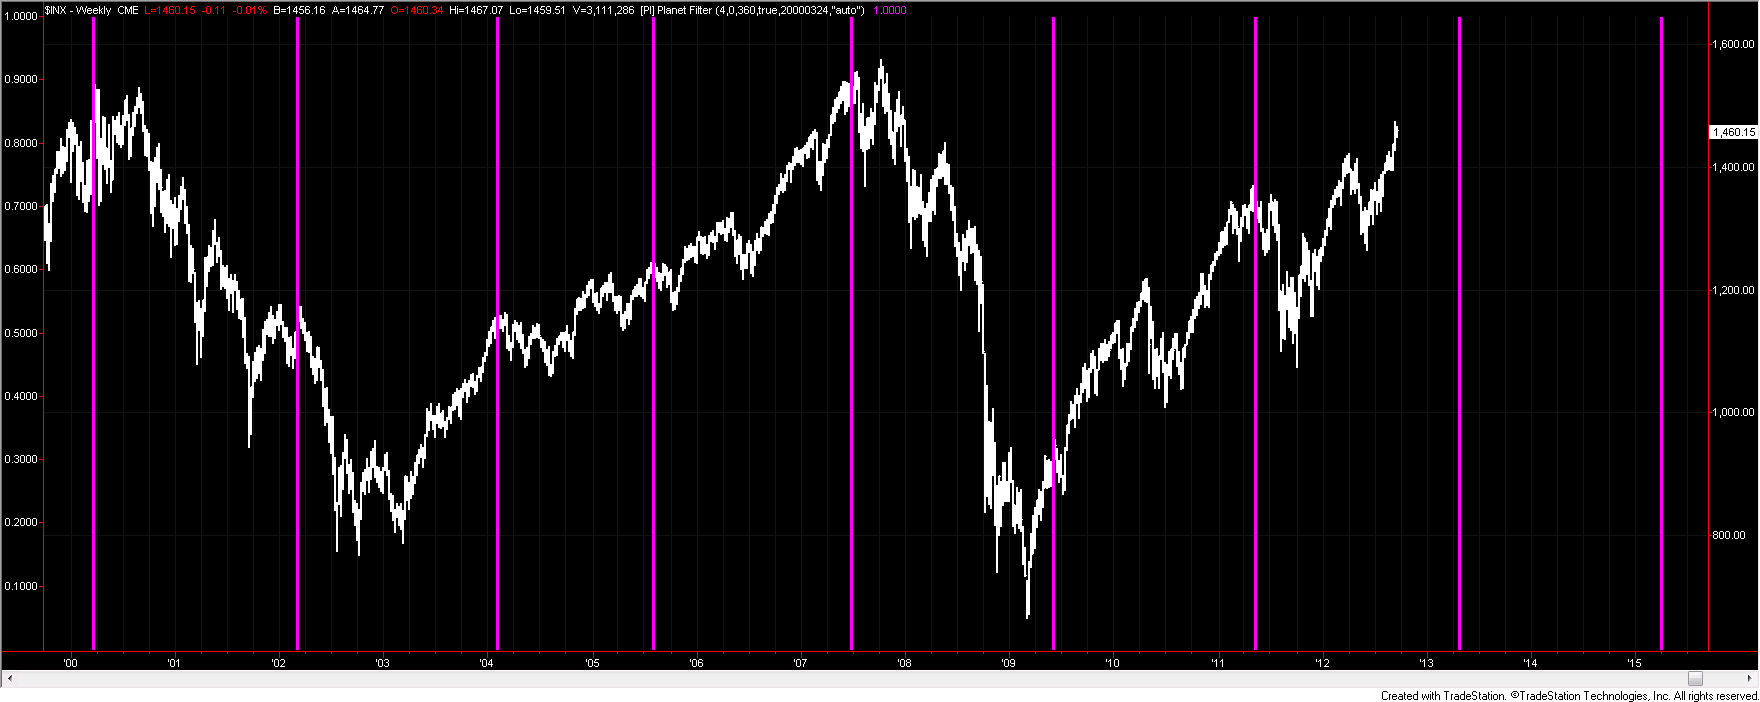
The following example chart shows the planetary returns of Mars starting with the high in the S&P500 in the year 2000. It is observable that the S&P soared into each return since then. Even more interesting, most important highs in the market since then took place exactly on a Mars return to the 2000 peak.
Backward from today (or any other date)
The second way of application for the Planetary returns is to go backward from a given date. The idea here is to highlight where in history the selected planet had the same position in the sky as it has today or on any other chosen date. If the highlighted dates coincide with important points in the market it gives some indication that the selected date can be an important point of similar quality.
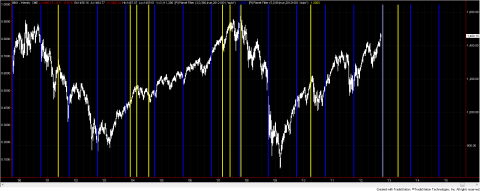
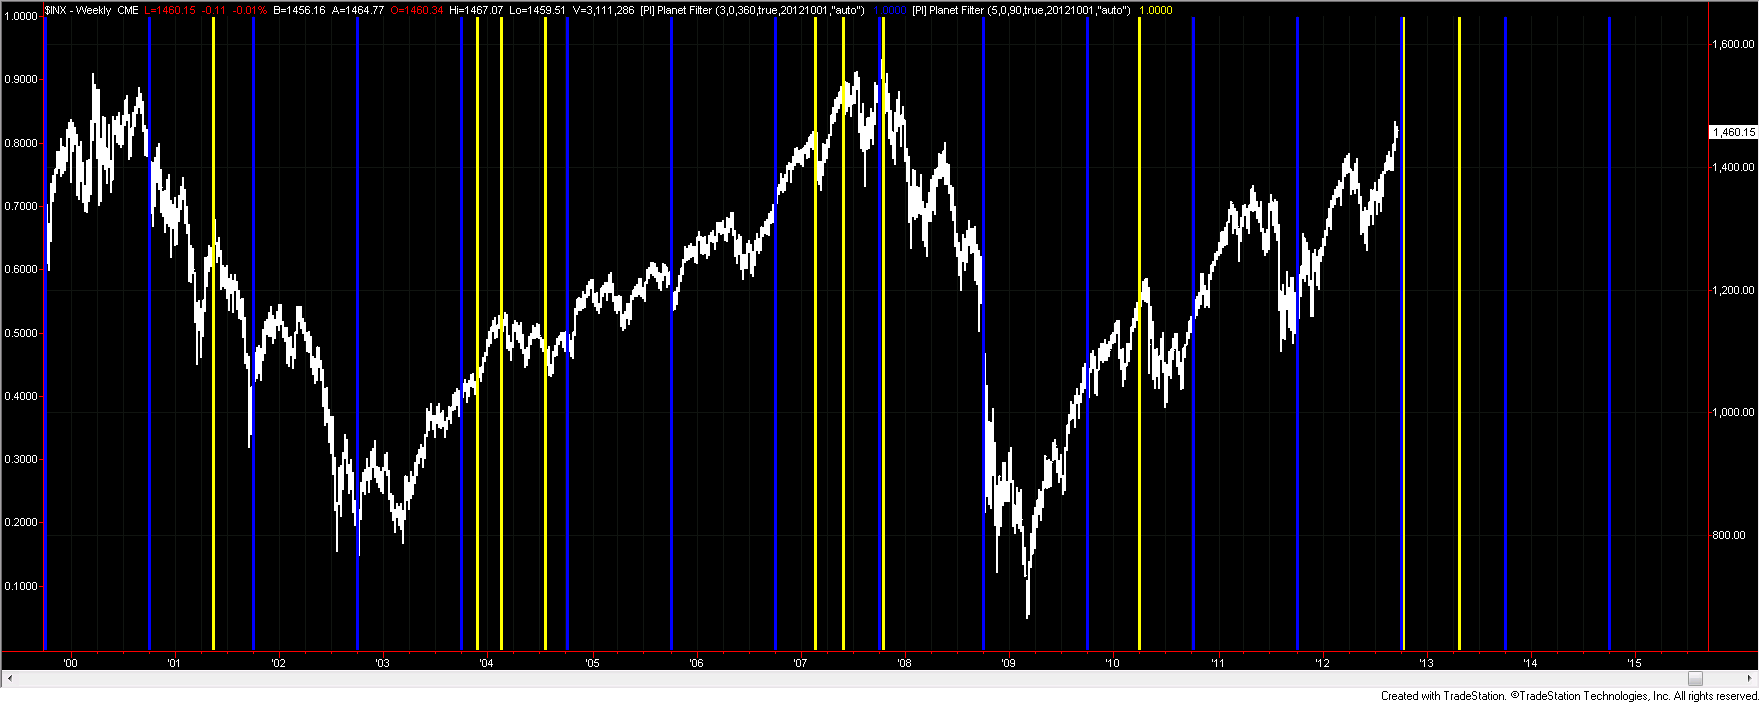
The following example shows two instances of the [PI] Planet Filter going backward from October 1st this year. The blue lines show the preceding Earth returns, the yellow lines show the 90 degrees Jupiter returns. The lines coincide with several important points (mostly highs, but also lows) in the S&P in near history. This implies that chances for a market turn around this time are above average.
I hope the examples could help to set up and use charts for planetary returns. If you have questions or maybe even better examples just contact me or leave a comment.
Paintbar Study Showing when a Planet is in a Certain Sign S&P: Time for a Turn?
Indication of Planetary Returns in Tradestation
Search
Recent Posts
- Update on S&P and 26 month cycle, 7 year cycle and Bradley
- Heliocentric Bradley vs Gold and Bonds
- Cycle Analysis S&P500
- Restart 2018
- Commitment of Traders: Sell signal in my new COT indicator
- Mid-November Low in S&P500
- Book recommendation: Timing Solutions for Swing Traders
- S&P: Time for a Turn?
- Indication of Planetary Returns in Tradestation
- Paintbar Study Showing when a Planet is in a Certain Sign
Tag Cloud