-
Heliocentric Bradley vs Gold and Bonds
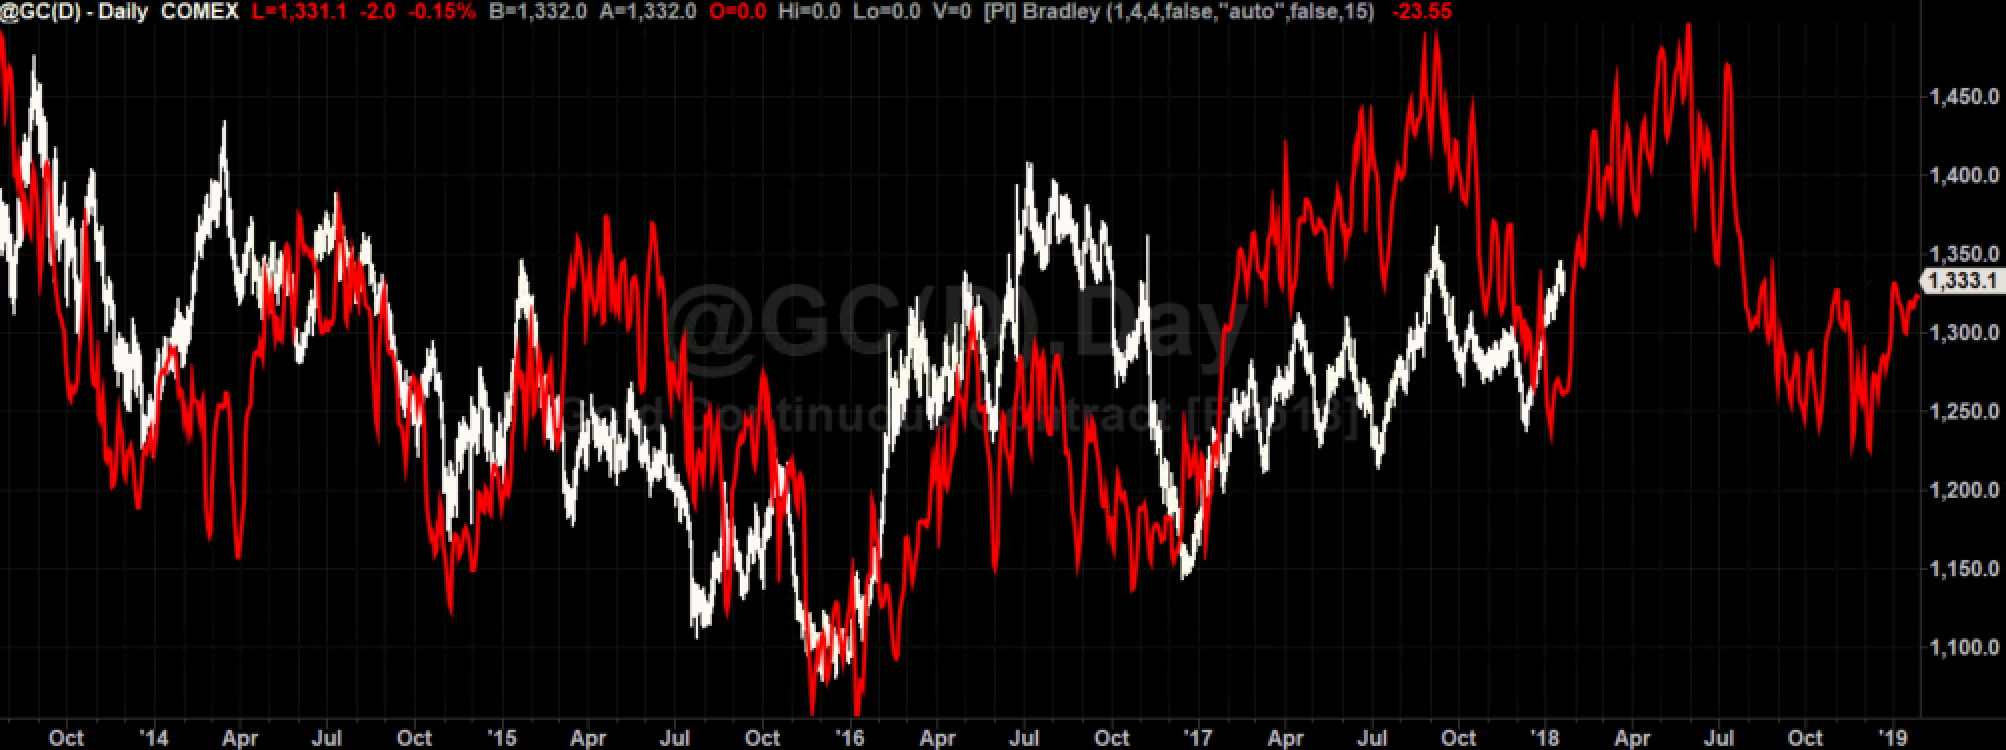
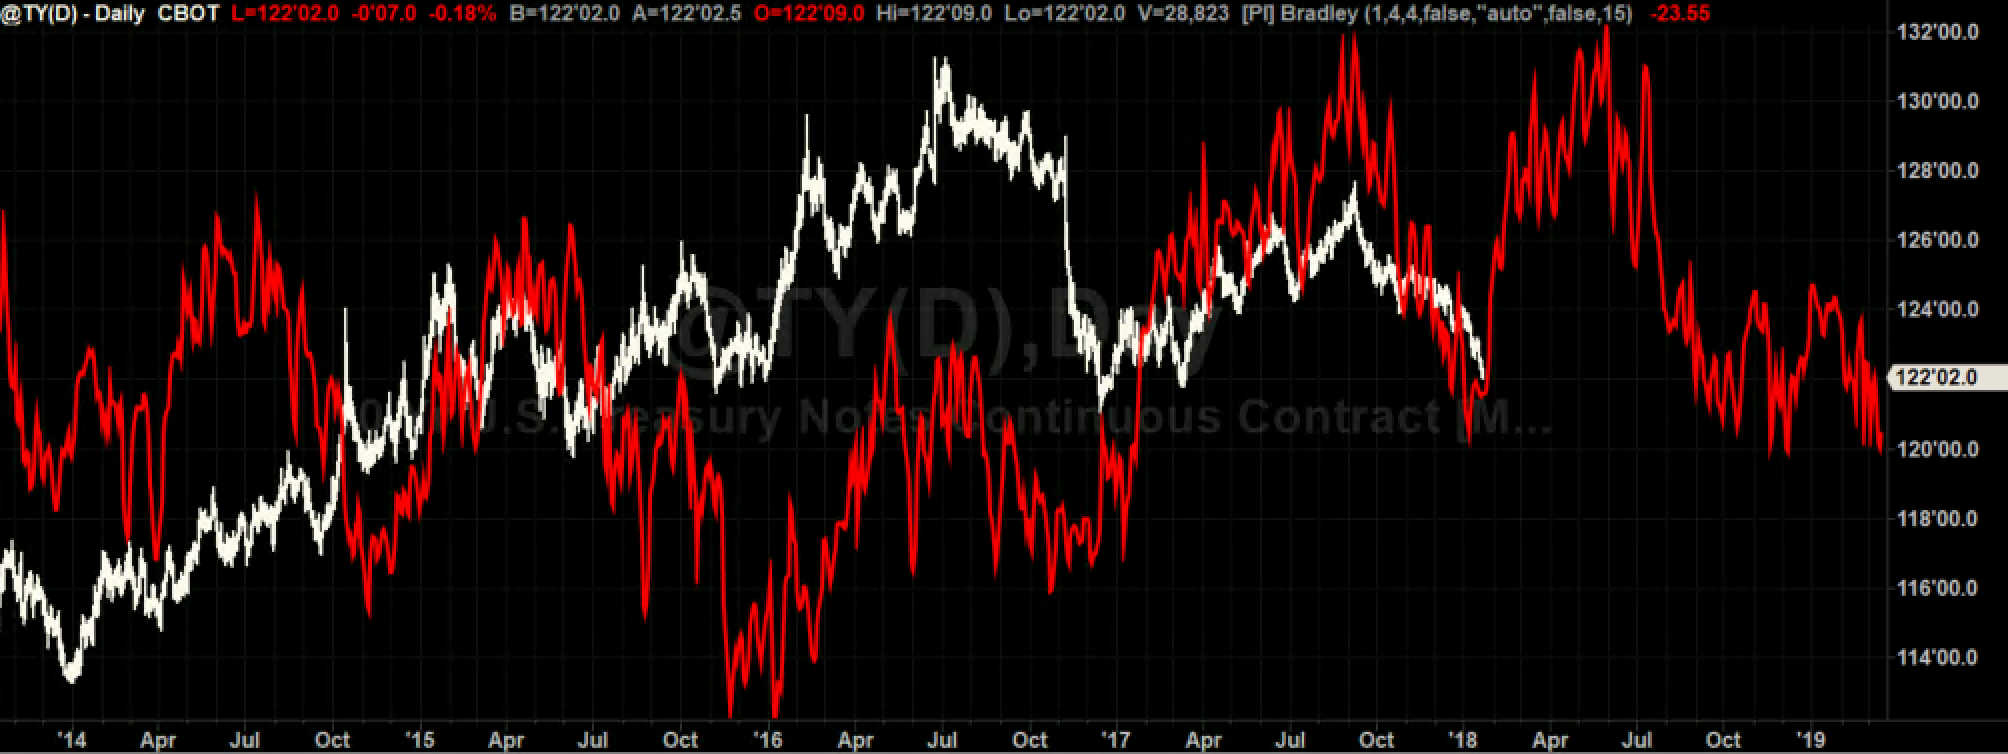
The Bradley Siderograph ([PI] Bralkey) can be applied to a variety of markets – sometimes with amazing results. In this article you can see the geocentric Bradley with default settings, projected on a Gold (@GC) and Bonds (@TY) charts. The Bradley is red and the market price is white. The overlap for the last 4 years – in particular for Gold – is mind blowing: important turning points and the market direction were predicted with an astonishing precision (note that the red plot was defined 70 years ago).
For 2018 the geocentric Bradley predicts an up-move until the mid of the year, followed by an extended down-move.
Here are the charts:
Gold future (@GC continuous contract)

US-Bonds (10 years, @TY continuous contract)

Cycle Analysis S&P500 Update on S&P and 26 month cycle, 7 year cycle and Bradley
Heliocentric Bradley vs Gold and Bonds
Search
Recent Posts
- Update on S&P and 26 month cycle, 7 year cycle and Bradley
- Heliocentric Bradley vs Gold and Bonds
- Cycle Analysis S&P500
- Restart 2018
- Commitment of Traders: Sell signal in my new COT indicator
- Mid-November Low in S&P500
- Book recommendation: Timing Solutions for Swing Traders
- S&P: Time for a Turn?
- Indication of Planetary Returns in Tradestation
- Paintbar Study Showing when a Planet is in a Certain Sign
Tag Cloud