-
Mid-November Low in S&P500
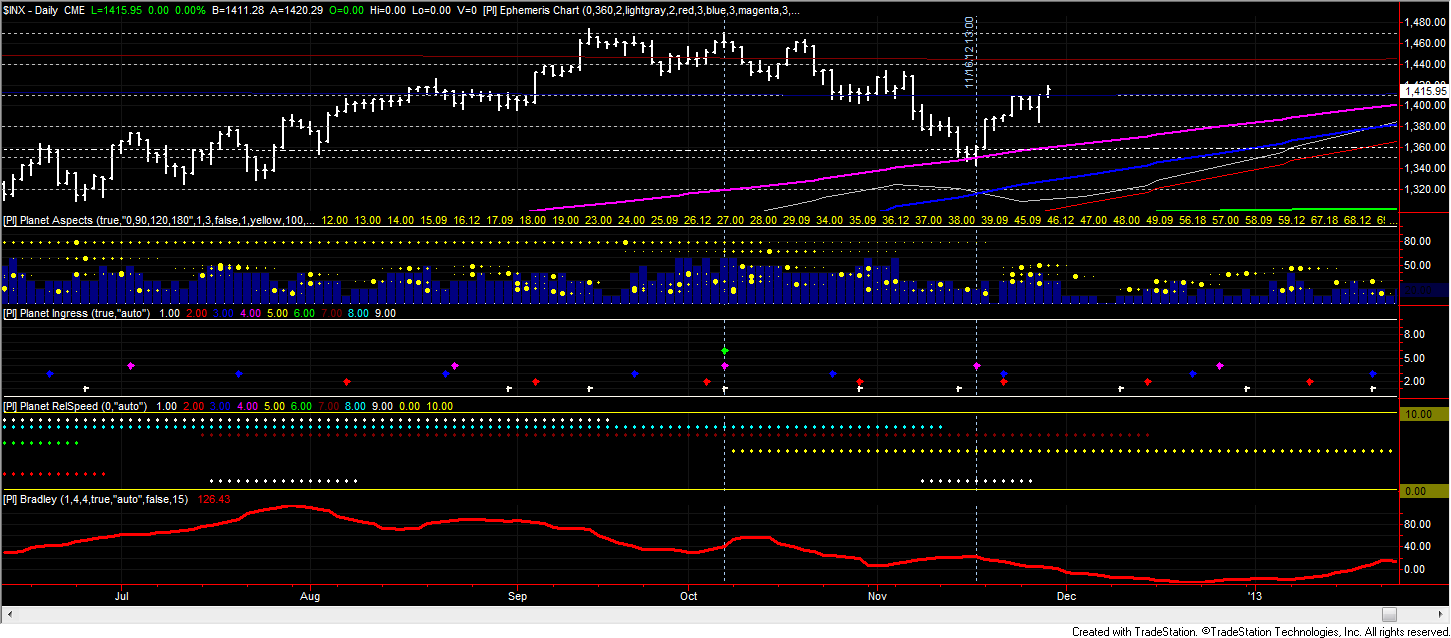
The following charts show how the planetary idicators could help to time the exit of the short position we entered at the quadruple ingress early October.

The S&P500 (chart of the index) went down to the Mars ephemeris line and bounced back the very day Mars had its ingress to Capricorn. Additionally we had a small peak in the Bradley indicator. Reason enough to take this low seriously – even though this time we had no peak in PI Aspects.
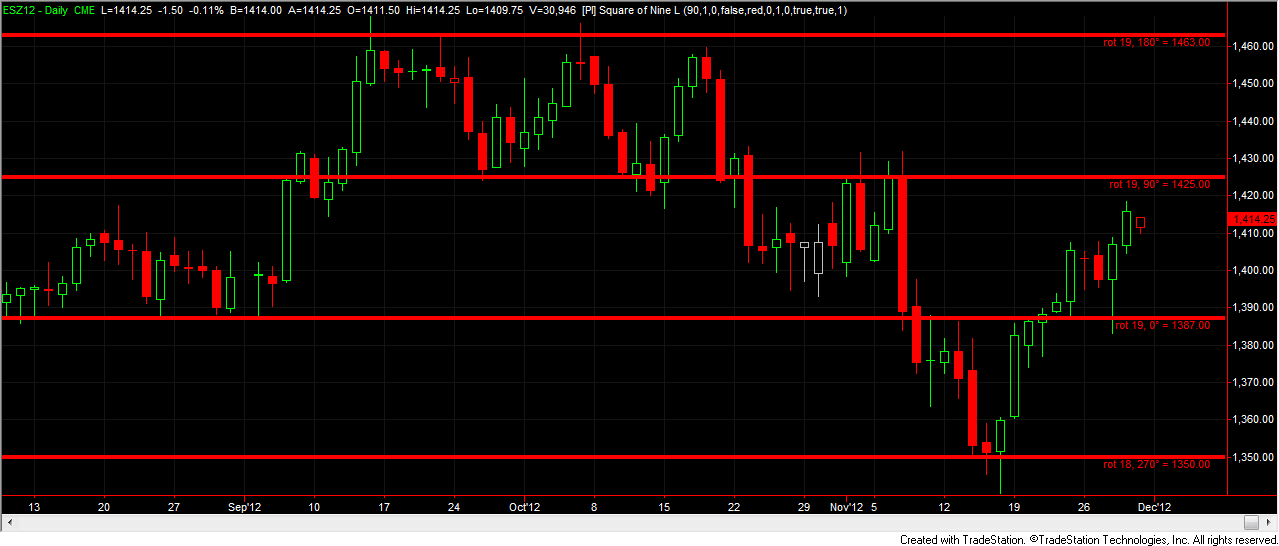
This also happened on an important absolute Square-of-Nine prive level as shown in the following chart.

I will discuss the Square of Nine indicators for price and time in more detail soon as they are a valuable addition to the planetary indicators.
Book recommendation: Timing Solutions for Swing Traders Commitment of Traders: Sell signal in my new COT indicator
Mid-November Low in S&P500
Search
Recent Posts
- Update on S&P and 26 month cycle, 7 year cycle and Bradley
- Heliocentric Bradley vs Gold and Bonds
- Cycle Analysis S&P500
- Restart 2018
- Commitment of Traders: Sell signal in my new COT indicator
- Mid-November Low in S&P500
- Book recommendation: Timing Solutions for Swing Traders
- S&P: Time for a Turn?
- Indication of Planetary Returns in Tradestation
- Paintbar Study Showing when a Planet is in a Certain Sign
Tag Cloud