-
Update on S&P and 26 month cycle, 7 year cycle and Bradley
This is a follow-up to the cycle analysis posted a month ago. There we saw that the 26 month and 7 year cycle have been the dominant cycles of the S&P 500.
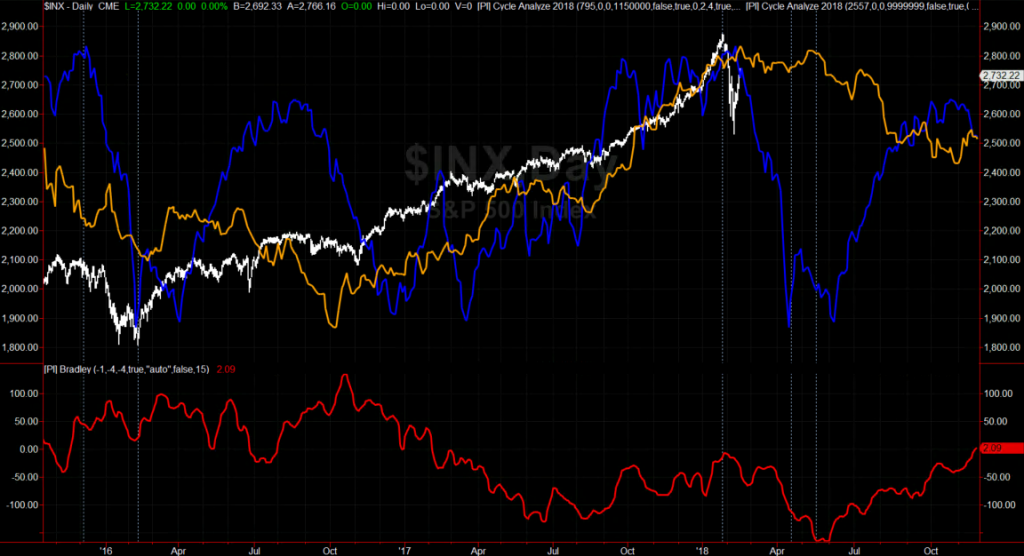
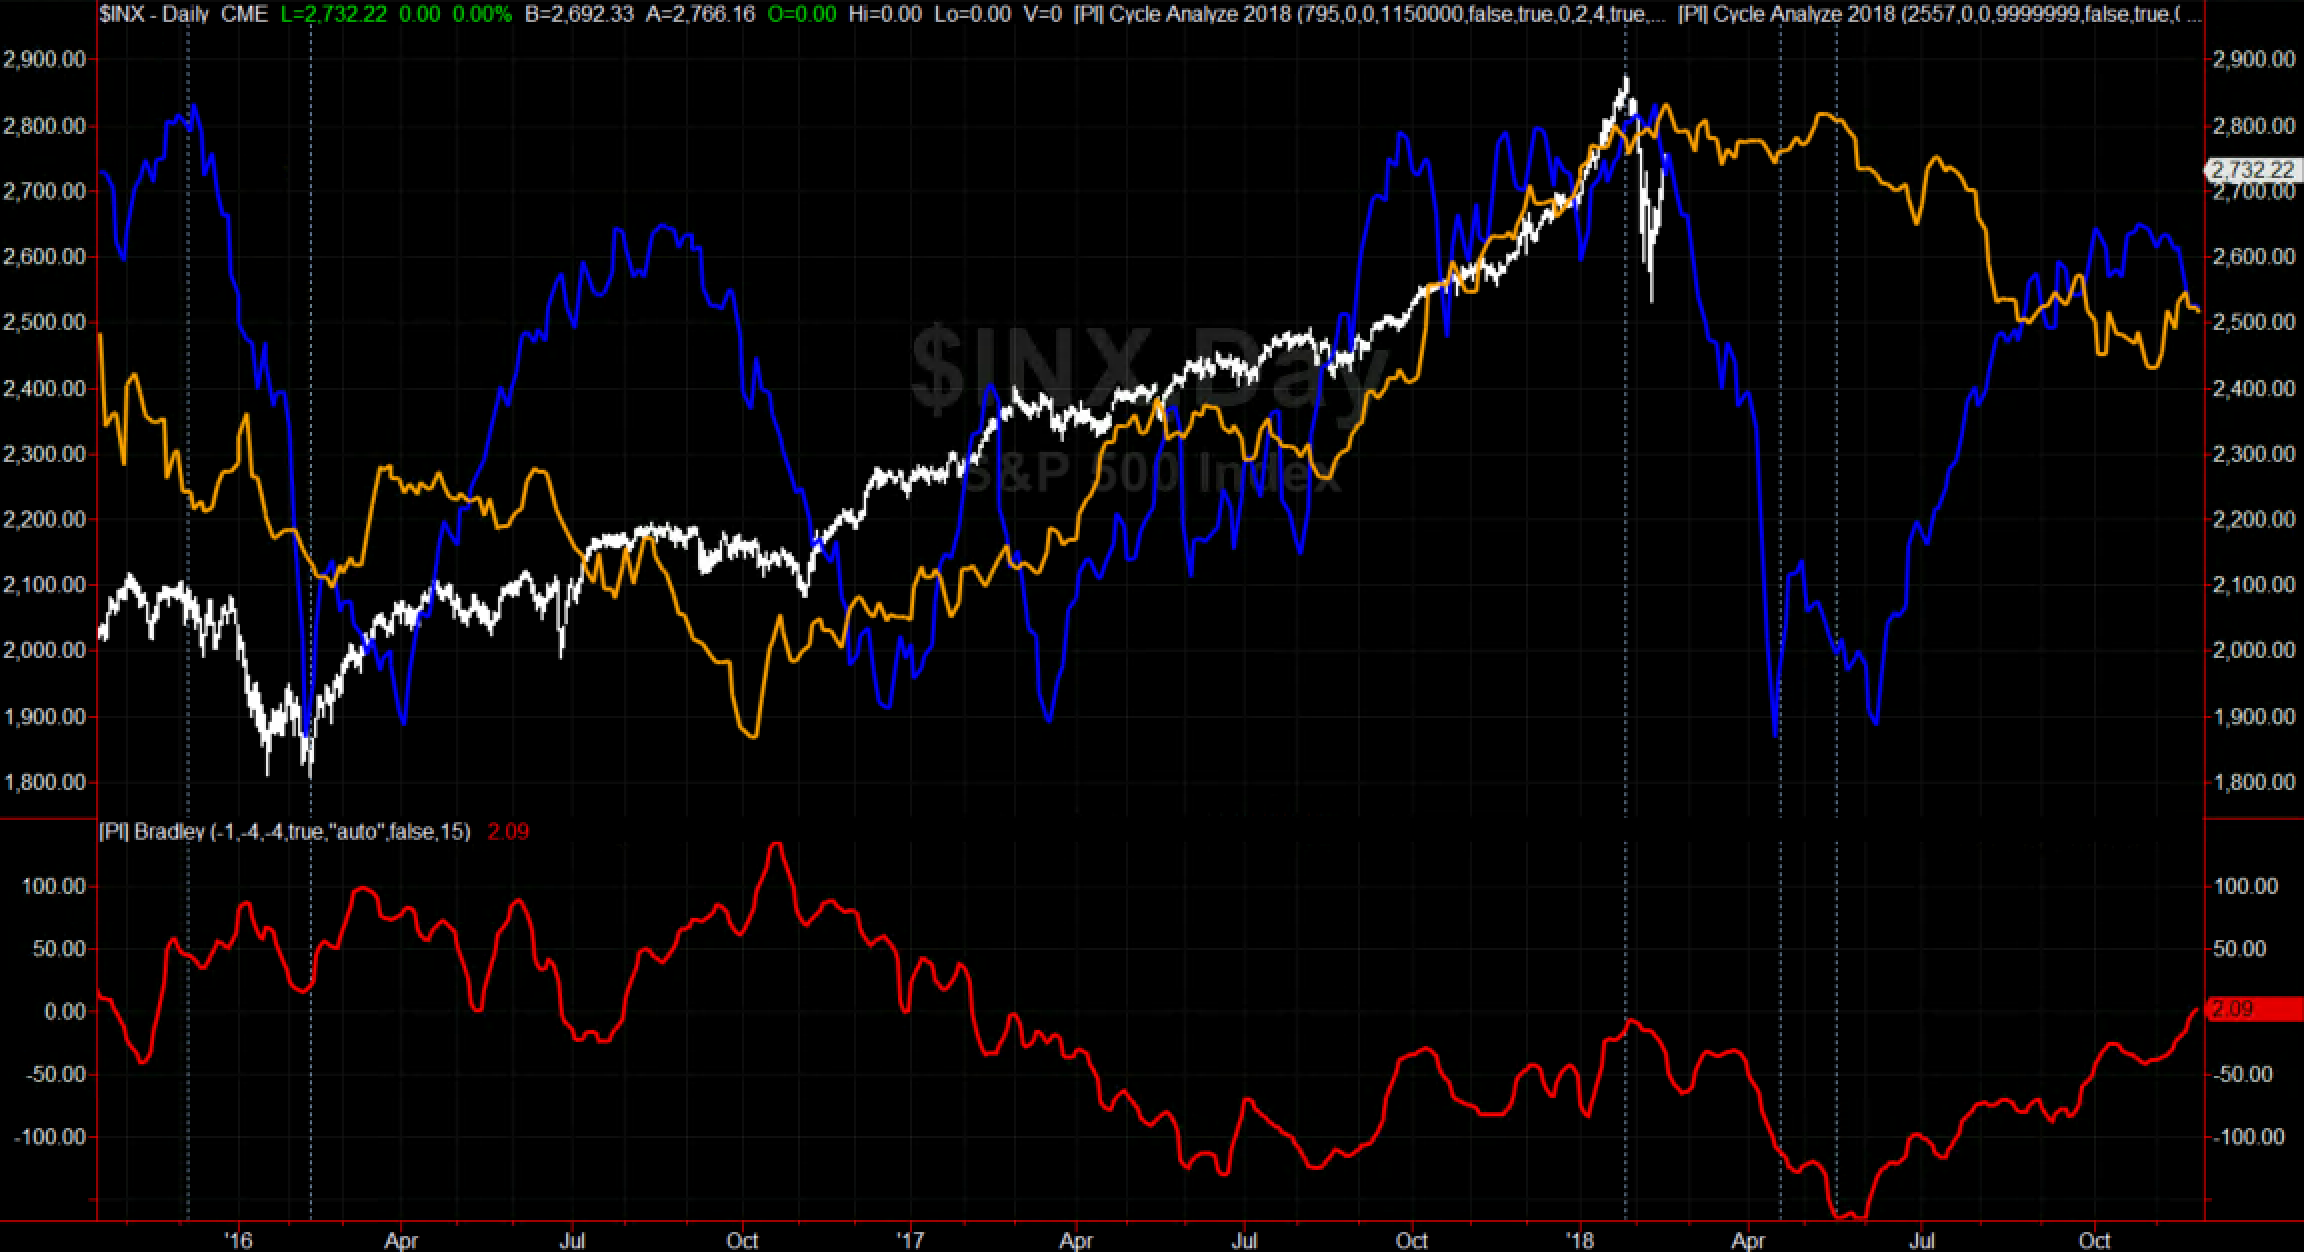
The chart below zooms in and shows the S&P 500 for the last two years (white) and the 26 month cycle (blue), the 7 year cycle (orange), and the inverted standard Bradley (red).
The 7 year cycle, which worked almost perfectly in the last few year, shows a multi-month top right now.
The 26 month cycle is in the middle of its weakest phase of the cycle, until April.
The Bradley had it’s most significant extreme of the winter half year exactly at the time of the high of the S&P.
Heliocentric Bradley vs Gold and Bonds
Update on S&P and 26 month cycle, 7 year cycle and Bradley
Search
Recent Posts
- Update on S&P and 26 month cycle, 7 year cycle and Bradley
- Heliocentric Bradley vs Gold and Bonds
- Cycle Analysis S&P500
- Restart 2018
- Commitment of Traders: Sell signal in my new COT indicator
- Mid-November Low in S&P500
- Book recommendation: Timing Solutions for Swing Traders
- S&P: Time for a Turn?
- Indication of Planetary Returns in Tradestation
- Paintbar Study Showing when a Planet is in a Certain Sign
Tag Cloud