-
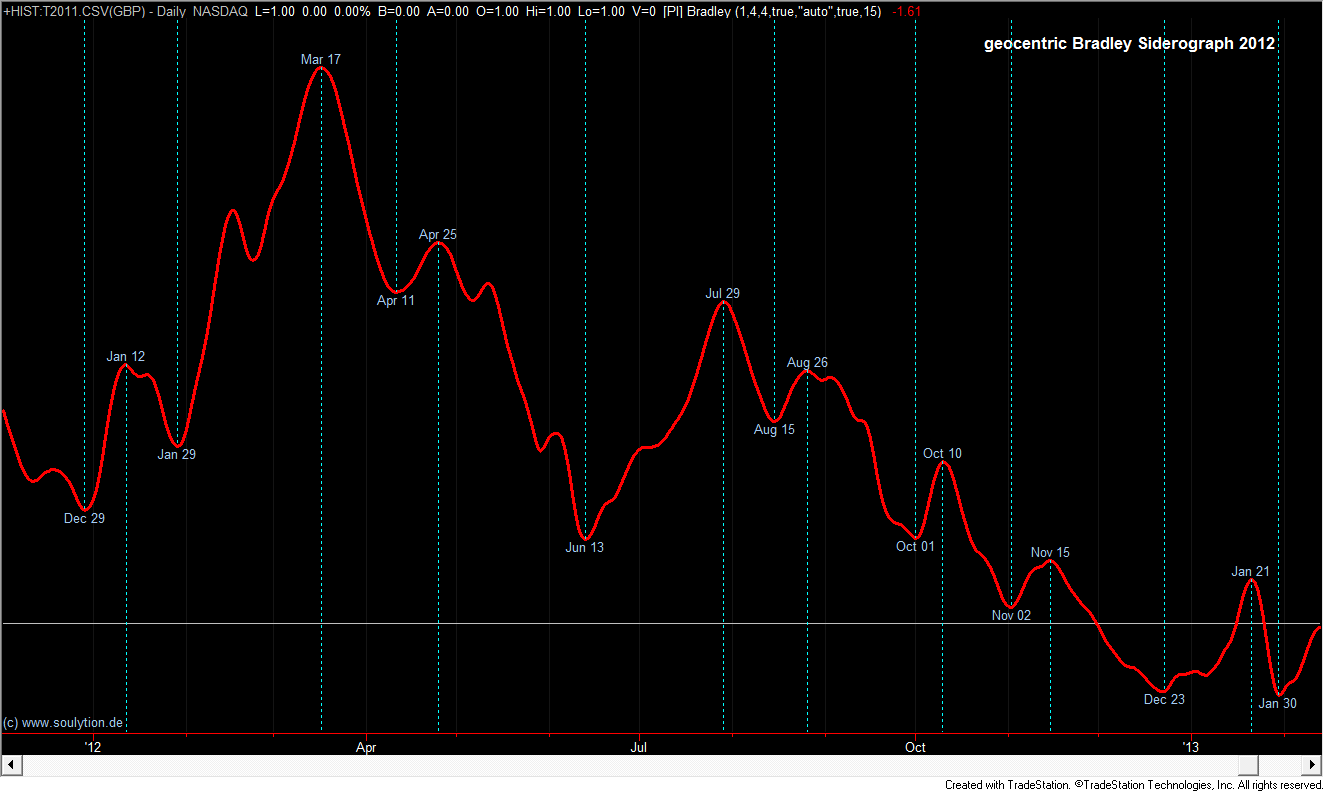
Bradley Siderograph 2012
Here is plot for the year 2012 of the geocentric default Bradley siderograph as described in Donald Bradley’s “Stock Market Prediction – The Planetary Barometer and How to Use It “.
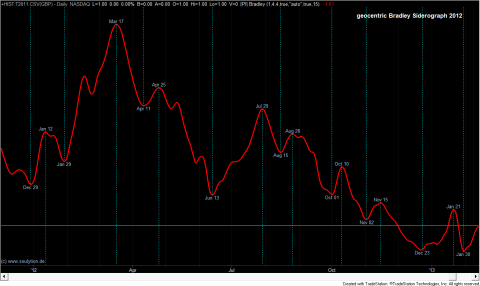
The plot was made with the [PI] Bradley indicator which it is part of the PlanetaryIndicators package for Tradestation.
In case you do not have Tradestation to apply this indicator, you can order future and historic Bradley data formated as text, CSV or Excel. Send me an email, or leave a comment and just let me know what you need.
Commitment of Traders: Implications of Large Traders going short Paintbar Study Showing when a Planet is in a Certain Sign
Bradley Siderograph 2012
Search
Recent Posts
- Update on S&P and 26 month cycle, 7 year cycle and Bradley
- Heliocentric Bradley vs Gold and Bonds
- Cycle Analysis S&P500
- Restart 2018
- Commitment of Traders: Sell signal in my new COT indicator
- Mid-November Low in S&P500
- Book recommendation: Timing Solutions for Swing Traders
- S&P: Time for a Turn?
- Indication of Planetary Returns in Tradestation
- Paintbar Study Showing when a Planet is in a Certain Sign
Tag Cloud