-
Tradestation indicator for Delta Phenomenon
In “The Delta Phenomenon†Welles Wilder described something he believes is the “hidden order in all marketsâ€. Now 26 years later the idea has been published in a lot of books and papers, and is no secret anymoreBasically the idea is that market vibration repeats
– Every 4 days (Short Term Delta),
– Every 4 lunar months (it’s called Intermediate Term Delta – I call it IMT)
– Every 12 lunar months (Medium Term Delta – MTD)
– Every 4 years (Long Term Delta – LTD)
– Every 19 years (Super Long Term Delta)Each period consists of a well-defined -but market specific- series. A series are usually 10 to 14 points that define times for highs and lows. Highs and lows alternate strictly, but in a special time window once in the period (Inversion Time window). In this window inversions are allowed – with all the implications for the rest of the cycle, because after the window the market is supposed to rotate strictly again until the next ITW. Once a series for a market is found, it can be applied until the end of all times – at least that’s the notion.
Ok, so I made an indicator implementing the simple framework for IMT and MTD for now. The indicator can be downloaded here (Delta Indicator for Tradestation 8.x). The imported indicator is [S09] Delta.
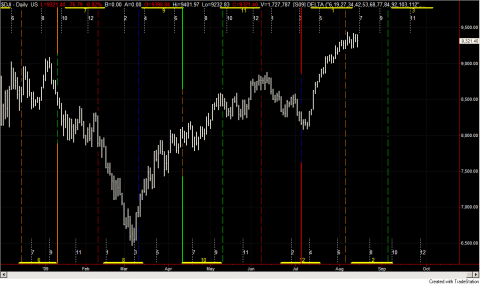
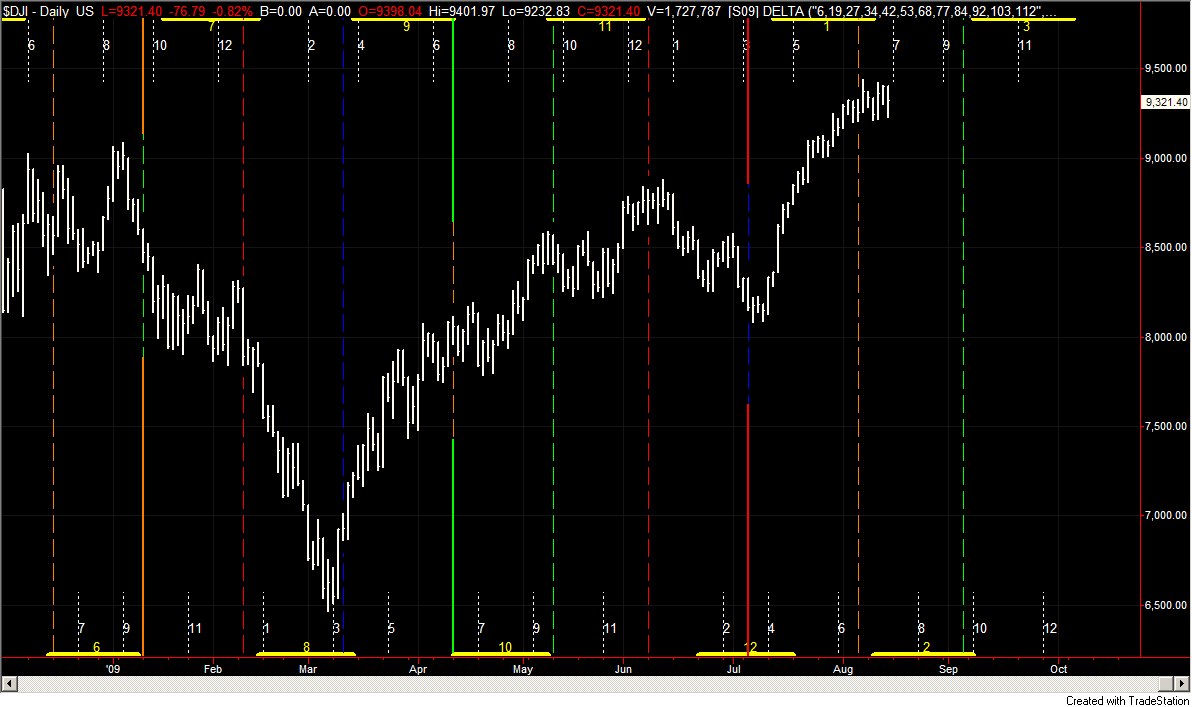
The indicator draws dashed lines for each full moon. I saw it in some publications that the first moon in the series is colored red, the second blue, the third orange and the fourth is green – so I use the coding here as well. The dashed line series is the IMT-sequence. Each third full moon is partially a solid line. That is one of the four anchor points of the IMT-cycle. Here I use the same color code. The first in the series is red.
Starting from the red anchors IMT counts the days and marks the days listed in the input “MarkDaysAfterRedMoonâ€. These marked days are counted subsequently starting from 1. Following the rotation rule, a high is followed by a low and a low is followed by a high. On the next red moon they start again from 1 – and they rotate until the end of all times. Then all additionally needed are inversions. Currently the indicator does not care for ITW. You can invert whenever you want. To make it easier you just define additional highs and lows (using inputs IMT.High.Dates and IMT.Low.Dates). So for example you think there is an inversion (double high) early June 2009, then add the date 1090601 to the IMT.Low.Dates-List. Then the next point in the series following the date will be forced to be a high. After that it will continue with alternation. For MTD it’s basically the same. The only difference is that for definition of the series you don’t need to count days, but weeks.
In the chart, IMT points are marked with small white dashed lines. The MTD points are yellow horizontal lines over two weeks. It allows fast and easy testing of the “Phenomenon”.
The picture shows the default settings in todays DJI chart.
I think the default settings work fine for most stock markets. If you have better parameters for some markets, it would be great you leave a comment.
Excel-Export aus Tradesignal EURUSD heliocentric basic analysis
2 thoughts on “Tradestation indicator for Delta Phenomenon”
Leave a Reply
Tradestation indicator for Delta Phenomenon
Search
Recent Posts
- Update on S&P and 26 month cycle, 7 year cycle and Bradley
- Heliocentric Bradley vs Gold and Bonds
- Cycle Analysis S&P500
- Restart 2018
- Commitment of Traders: Sell signal in my new COT indicator
- Mid-November Low in S&P500
- Book recommendation: Timing Solutions for Swing Traders
- S&P: Time for a Turn?
- Indication of Planetary Returns in Tradestation
- Paintbar Study Showing when a Planet is in a Certain Sign
Tag Cloud
I want to thank the blogger very much not only for this post but also for his all previous efforts. I found soulytion.de to be very interesting. I will be coming back to soulytion.de for more information.
Thank you allowing the download of this indicator. I may or may not use it in my trading but it is interesting to follow it since there is so much hype about it.