-
S&P500 update Oct/11th 2009
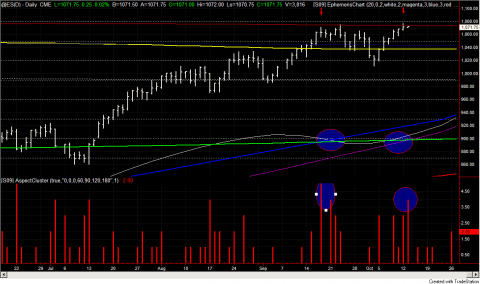
Once again an example with just the @ES, the ephemeris lines, and this time with the aspect cluster indicator.
Aspect cluster just sums up the interesting aspects for each day. When there is a peek it means something interesting could happen
Today the market hit the Uranus ephemeris line (dark red) again. The same time we have this Saturn (green) conjunction with Venus (Purple) and Mercury (white). Just like few weeks ago we have another aspect cluster peak.
Indication of Planetary Retrograde Movement New Version of Planetary Indicators Package for TradeStation
S&P500 update Oct/11th 2009

Search
Recent Posts
- Update on S&P and 26 month cycle, 7 year cycle and Bradley
- Heliocentric Bradley vs Gold and Bonds
- Cycle Analysis S&P500
- Restart 2018
- Commitment of Traders: Sell signal in my new COT indicator
- Mid-November Low in S&P500
- Book recommendation: Timing Solutions for Swing Traders
- S&P: Time for a Turn?
- Indication of Planetary Returns in Tradestation
- Paintbar Study Showing when a Planet is in a Certain Sign
Tag Cloud