-
It’s Bradley Time
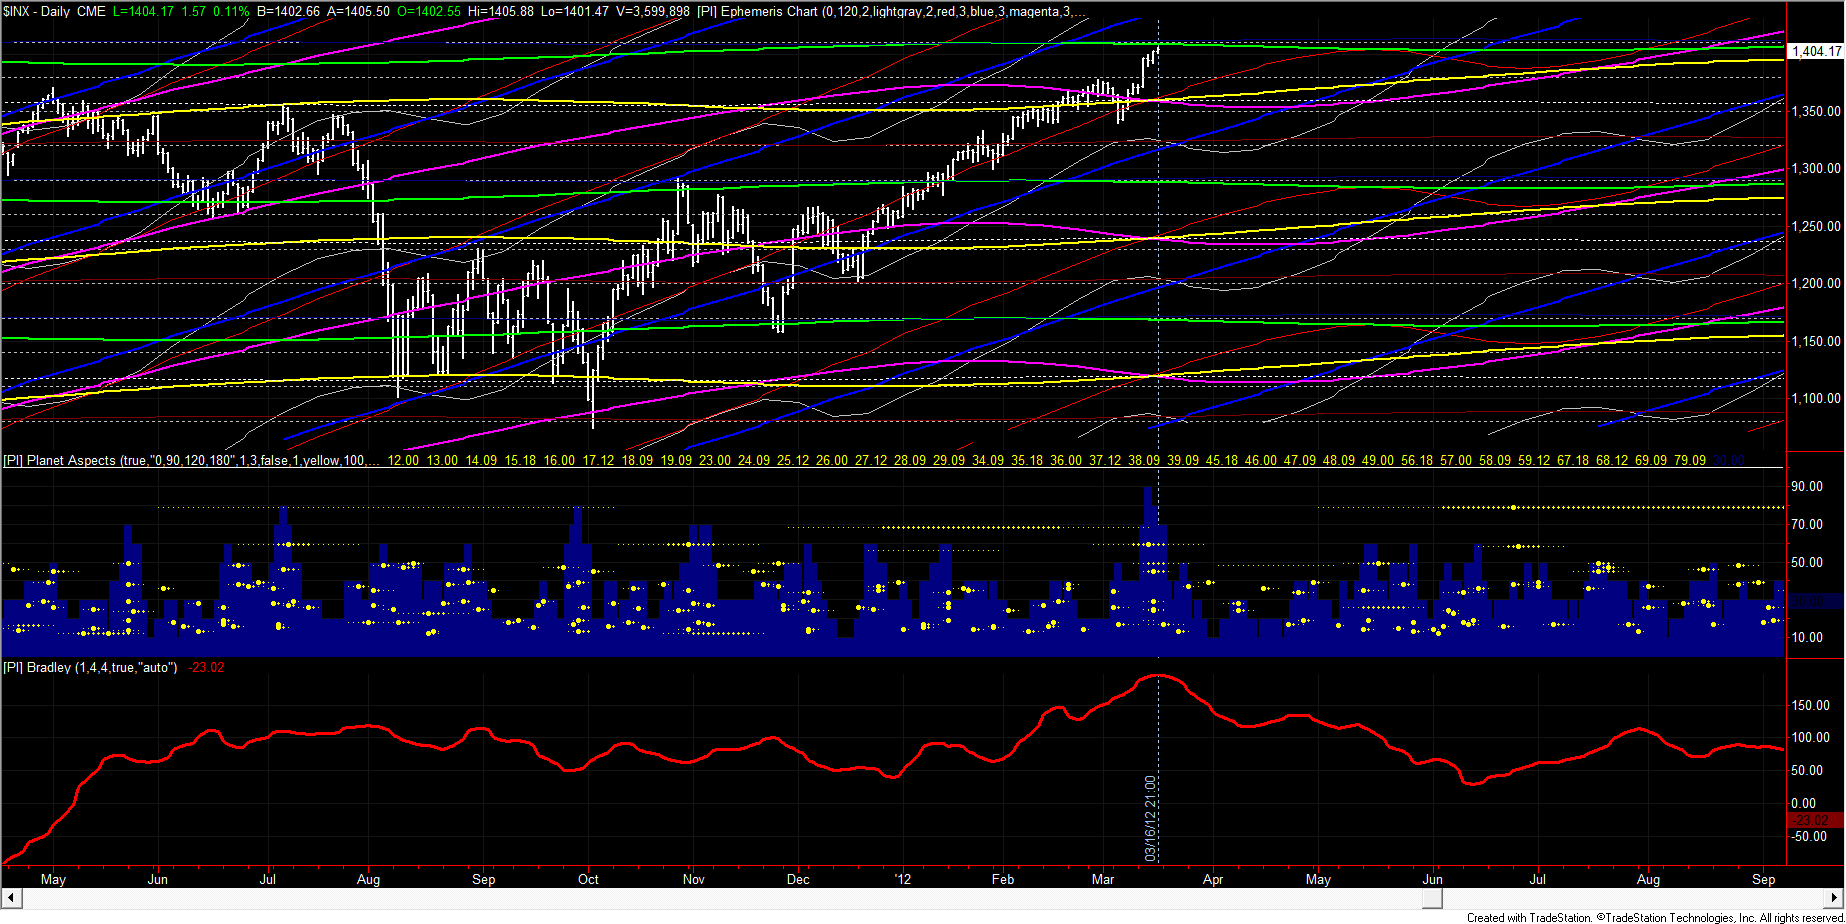
This weekend the geocentric Bradley indicator has the high for the year. At the same time (not coincidentally) my preferred planetary aspects indicator shows the highest activity since forever.
The following chart shows both indicators and the S&P500 which is making new highs.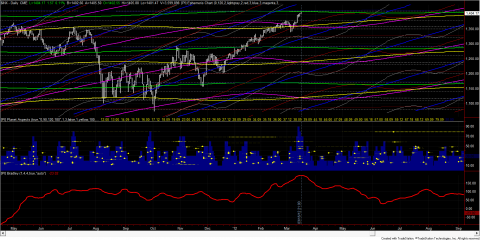
Basically, it can be assumed that such a cluster of aspects will result in a turn in the markets. And in fact, for the S&P500 in recent years I couldn’t find an example where for similar planetary activity there wasn’t a intermediate turn within a window of one week. Positive examples are the February high, the July high and the October low last year.
High planetary activity does not only coincides with turning points in stock markets but with other markets as well. That is why the lows in EURUSD, Gold and in particular in the interest rates (Bond high) could be indicative for the weeks to come.
On the Compatibility of the Planetary Indicators to MultiCharts Commitment of Traders: Implications of Large Traders going short
It’s Bradley Time
Search
Recent Posts
- Update on S&P and 26 month cycle, 7 year cycle and Bradley
- Heliocentric Bradley vs Gold and Bonds
- Cycle Analysis S&P500
- Restart 2018
- Commitment of Traders: Sell signal in my new COT indicator
- Mid-November Low in S&P500
- Book recommendation: Timing Solutions for Swing Traders
- S&P: Time for a Turn?
- Indication of Planetary Returns in Tradestation
- Paintbar Study Showing when a Planet is in a Certain Sign
Tag Cloud