-
Bradley Siderograph 2010
Happy New Year 2010!
Looking at the Bradley graph this year can be quite interesting:
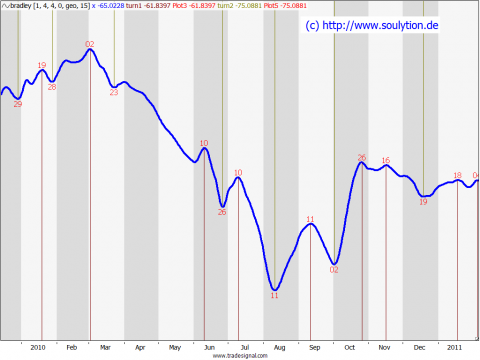
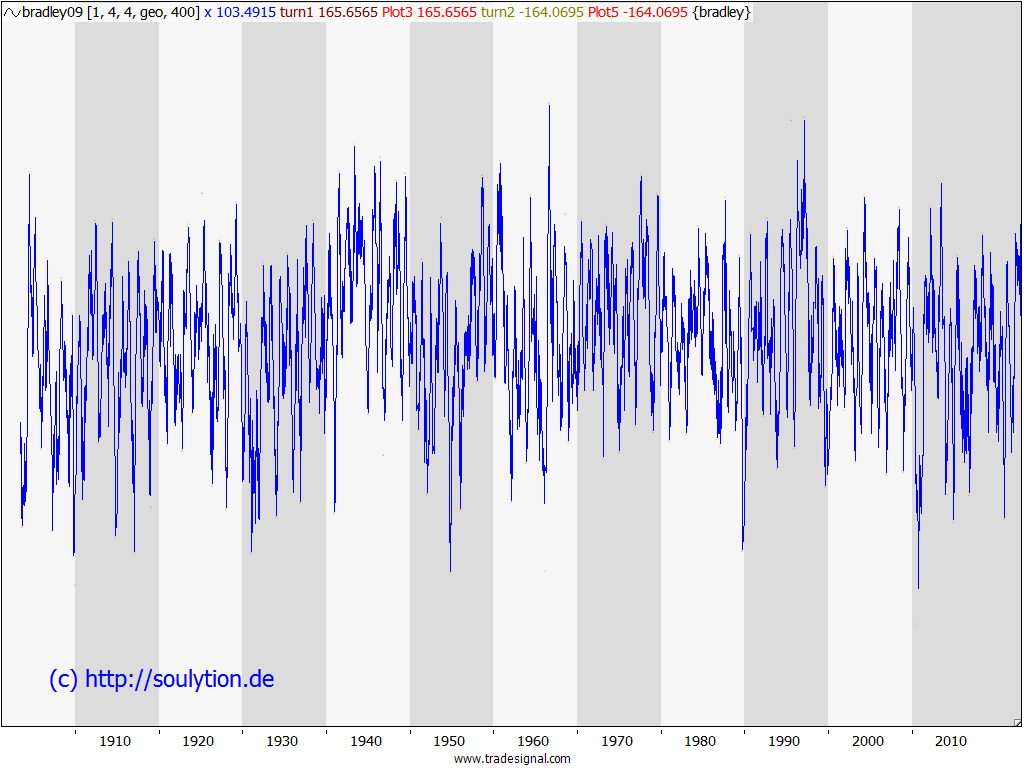
Sure, the one year view is not so impressive. But have a look at the long term. The low of geocentric Bradley in 2010 is the lowest low since 1900.

Such extreme points in the Bradley do not necessarily mean there will be a sort of crash. They don’t even mean that there will be any sort of low. Rather they usually indicate the end of one (long term) cycle in the markets and the start of a new one.Now is the question: will it conclude the consolidation in stock markets we’ve seen in the last ten years? Or will it finally finish the bull market that started 30/40 years ago? Guess what, I don’t know 🙂
New Version of Planetary Indicators Package for TradeStation Simple TradeStation Strategy based on Planetary Indicators
Bradley Siderograph 2010

Search
Recent Posts
- Update on S&P and 26 month cycle, 7 year cycle and Bradley
- Heliocentric Bradley vs Gold and Bonds
- Cycle Analysis S&P500
- Restart 2018
- Commitment of Traders: Sell signal in my new COT indicator
- Mid-November Low in S&P500
- Book recommendation: Timing Solutions for Swing Traders
- S&P: Time for a Turn?
- Indication of Planetary Returns in Tradestation
- Paintbar Study Showing when a Planet is in a Certain Sign
Tag Cloud